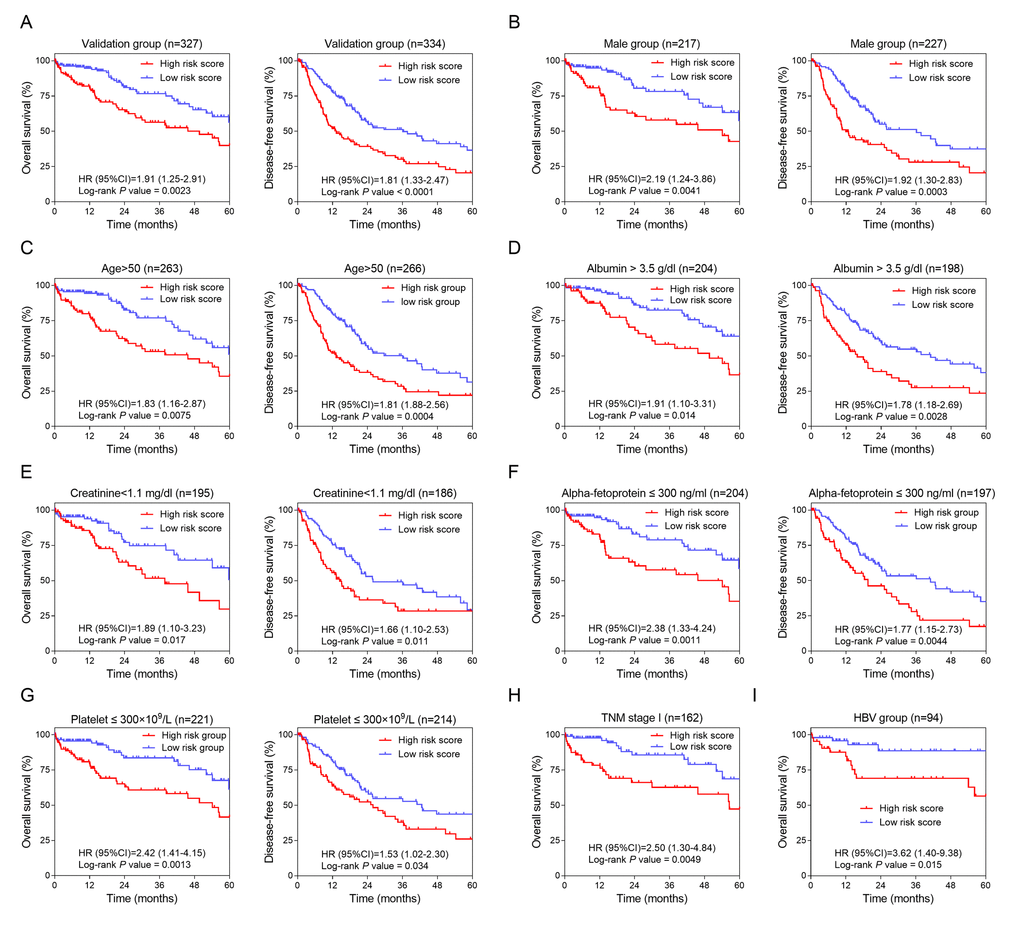
Figure 4.Validation and development of HCC-specific risk score system. (A) Kaplan-Meier curves of OS (Left) and DFS (Right) in the validation dataset. (B, C, D, E, F and G) Kaplan-Meier curves of OS (Left) and DFS (Right) in the subgroups stratified by gender (Male) (B), age (>50) (C), ALB (> 3.5 g/dl) (D), CRE (< 1.1 mg/dl) (E), AFP (≤ 300 ng/ml) (F) and PLT (≤ 300×109/L) (G). (H and I) Kaplan-Meier curves of OS in the subgroups stratified by TNM stage (stage I) (H) and HBV infection (I).