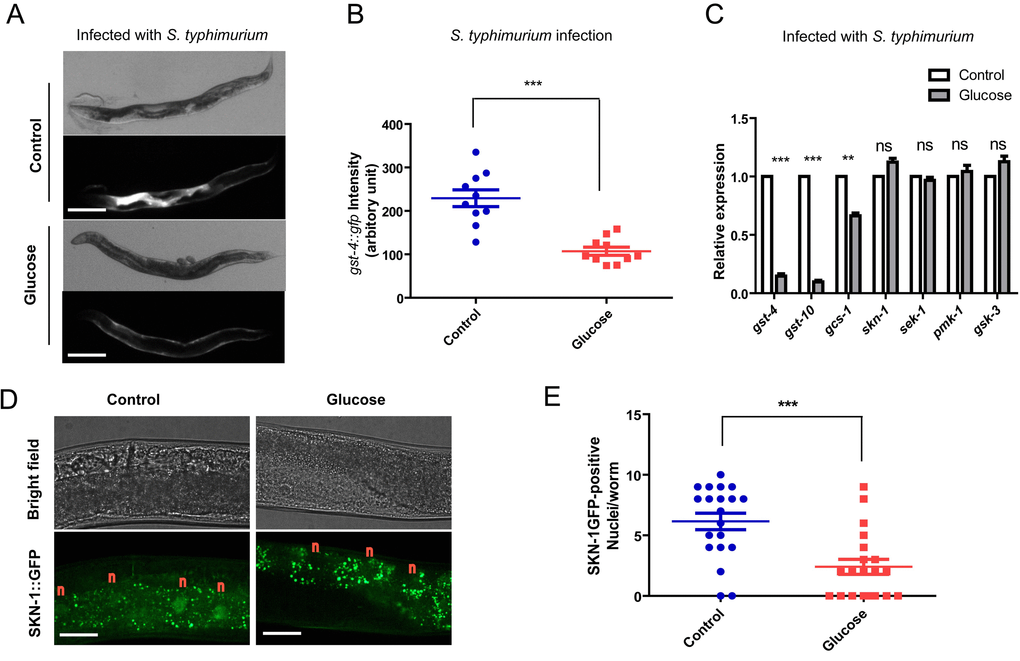
Figure 2.Glucose medium decreases SKN-1 activity. (A) SKN-1 reporter gst-4::gfp is suppressed by high glucose medium. Animals expressing the SKN-1 reporter gst-4::gfp were cultured in medium supplemented with and without 0.5% glucose from L1 stage to L4/young adult stag, then transferred to infection plate without glucose for 2 days before imaging. Shown are representative images of at least 4 independent experiments (20 animals each). Scale bars are 200 µm. (B) Quantification of experimental results in Fig 2A by measuring the signal intensity of 10 animals from 1 experiment by ImageJ software. P values were obtained by student’s t-test. ***, P<0.0001. Error bars indicates standard error of the mean (SEM). (C) SKN-1 target genes (gst-4, gst-10, gcs-1) but not skn-1 and upstream kinase genes (sek-1, pmk-1, gsk-3) are affected by glucose. Animals raised on medium with and without glucose from L1 to L4/young adult stage were infected by S. typhimurium for 2 days. mRNA were extracted and reverse transcribed to cDNA. Quantitative RT-PCR was conducted using established primer sets and protocols. Shown are representative data from 1 of 2 independent experiments. Error bars indicate standard error of the mean (SEM) of 3 replicates. P values were obtained by student’s t-test. **, P<0.001; ***, P<0.0001; ns, not significant. (D) Glucose inhibits SKN-1 nuclear localization upon infection. Transgenic C. elegans expressing skn-1::gfp were raised on medium with and without glucose from L1 stage to L4/young adult stag, then infected with S. typhimurium for 2 days before imaging. Shown are representative image of 2 independent experiments. “n” marks above the nucleus of intestinal cells. Scale bars are 40 µm. The punctate signals in the intestine are non-specific signals as also shown in Fig. S4. (E)Quantification of experimental results in Fig 2D by counting the SKN-1::GFP positive nuclei/worms of about 20 worms. Shown are representative data from 1 of the 2 independent experiments. Error bars stands for standard error of the mean (SEM). P values were obtained by student’s t-test. ***, P<0.0001.