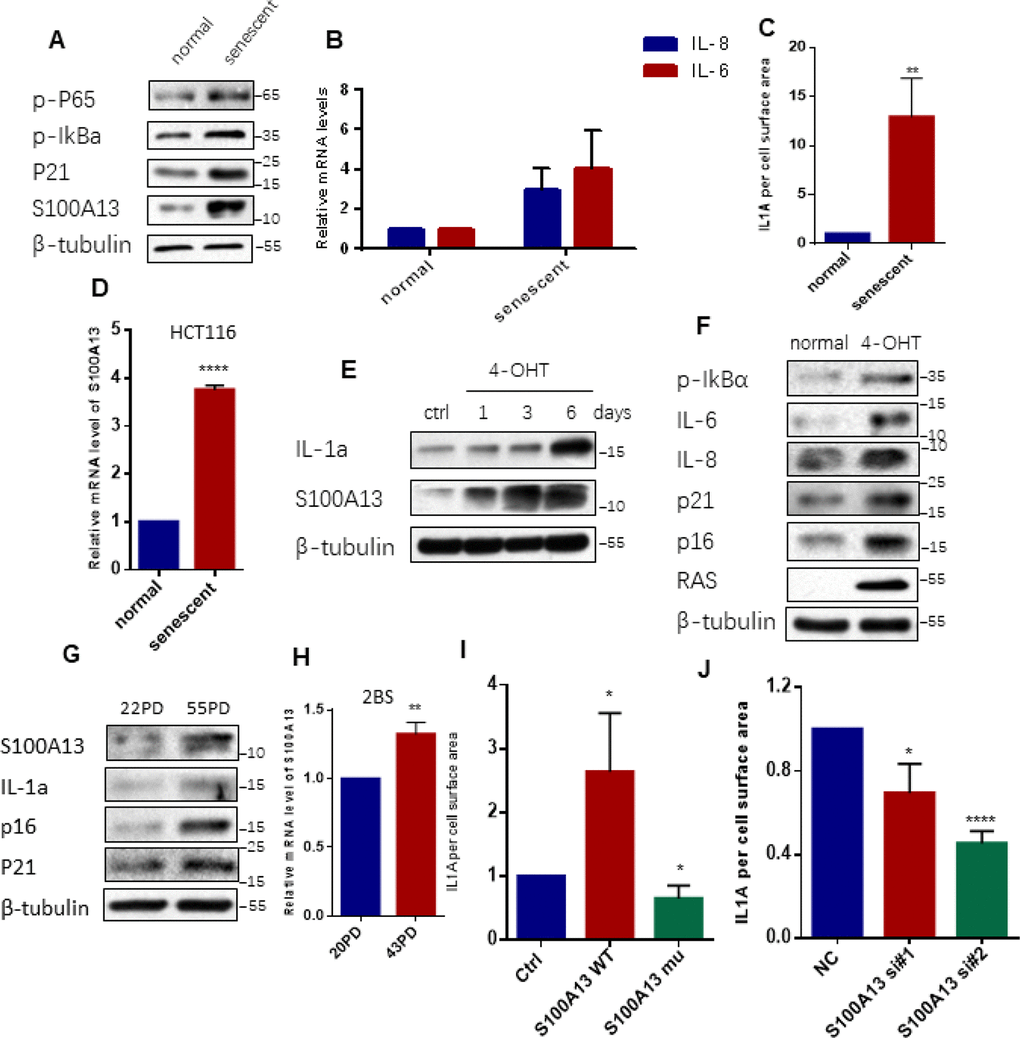
Figure 1.S100A13 is up-regulated and modulates cell surface-bound IL-1α level during cellular senescence(A–D) Normal HCT116 cells either untreated or treated with 100 nM Dox for 4 days. (A) Cell lysates were subjected to western blot analysis using the indicated antibodies. (B) The mRNA levels of IL-6/IL-8 were analyzed by real-time qPCR. (C) The cells were collected, washed, incubated in PBS with FITC-labeled monoclonal antibodies against IL-1α, and processed by FACS analysis to determine the amount of cell surface-bound IL-1α. The histograms were the percent of total fluorescence signal subtracting the background fluorescence for unlabeled cells (n=3). (D) The mRNA levels of S100A13 were analyzed by real-time qPCR (n=3). (E) ER:Ras IMR90 cells were given 100 nM 4-OHT for the indicated days to induce Ras expression, fresh medium with 4-OHT was changed every other day. Cell lysates were then analyzed for expression of the indicated proteins. (F) ER:Ras IMR90 cells were given 4-OHT for 6 days to induce senescence. Cell lysates were then subjected to Western blot analysis for the indicated proteins. (G and H) 20PD, 55PD and 43PD 2BS cells were collected, and total proteins and/or total RNAs were extracted, respectively. (G) Cell lysates were analyzed by Western blot for the indicated proteins. (H) The mRNA levels of S100A13 were analyzed by real-time qPCR (n=3). (I) Cells transfected with the siRNA#2 against S100A13 first, then followed by transfection with control vector, the same sense mutation plasmids of S100A13 wild type or mutant type which were insensitive to the siRNA#2 , and then treated with Dox (100 nM) for 3 days, and then cell surface-bound IL-1α were analyzed by FACS (n=3). (J) Cells transfected with the control (siNC) or two independent siRNAs against S100A13, then treated with Dox (100 nM) for 4 days, and then cell surface-bound IL-1α were analyzed by FACS (n=3). Three independent experiments were analyzed. Error bars represent means ± SD (n = 3) *P < 0.05, **P < 0.01, ***P < 0.005, ****P < 0.001 in (B), (C), (D), (H), (I) and (J).