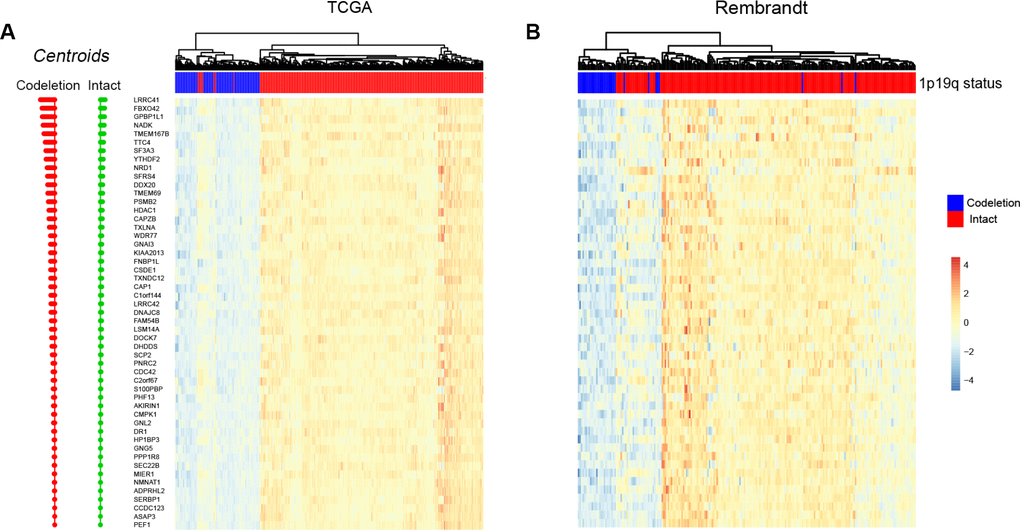
Figure 3.Predicting 1p/19q status by PAM algorithm. The hierarchical clustering samples in TCGA and Rembrandt cohorts using 53 signature genes, respectively.
Figure 3 — Predicting chromosome 1p/19q codeletion by RNA expression profile: a comparison of current prediction models | Aging