Submit an Article
Navigate
Home
Editorial Board
Editorial Policies
Current Volume
Archive
Scientific Integrity
Publication Ethics Statements
Interviews with Outstanding Authors
Newsroom
Sponsored Conferences
Podcast
Contact
Special Collections
Submit an Article
Online ISSN: 1945-4589
Research Paper
|
Volume 11, Issue 4
|
pp. 1262–1282
Longitudinal plasma metabolomics of aging and sex
Back to article
Figure 3
(3 of 3)
−
100%
+
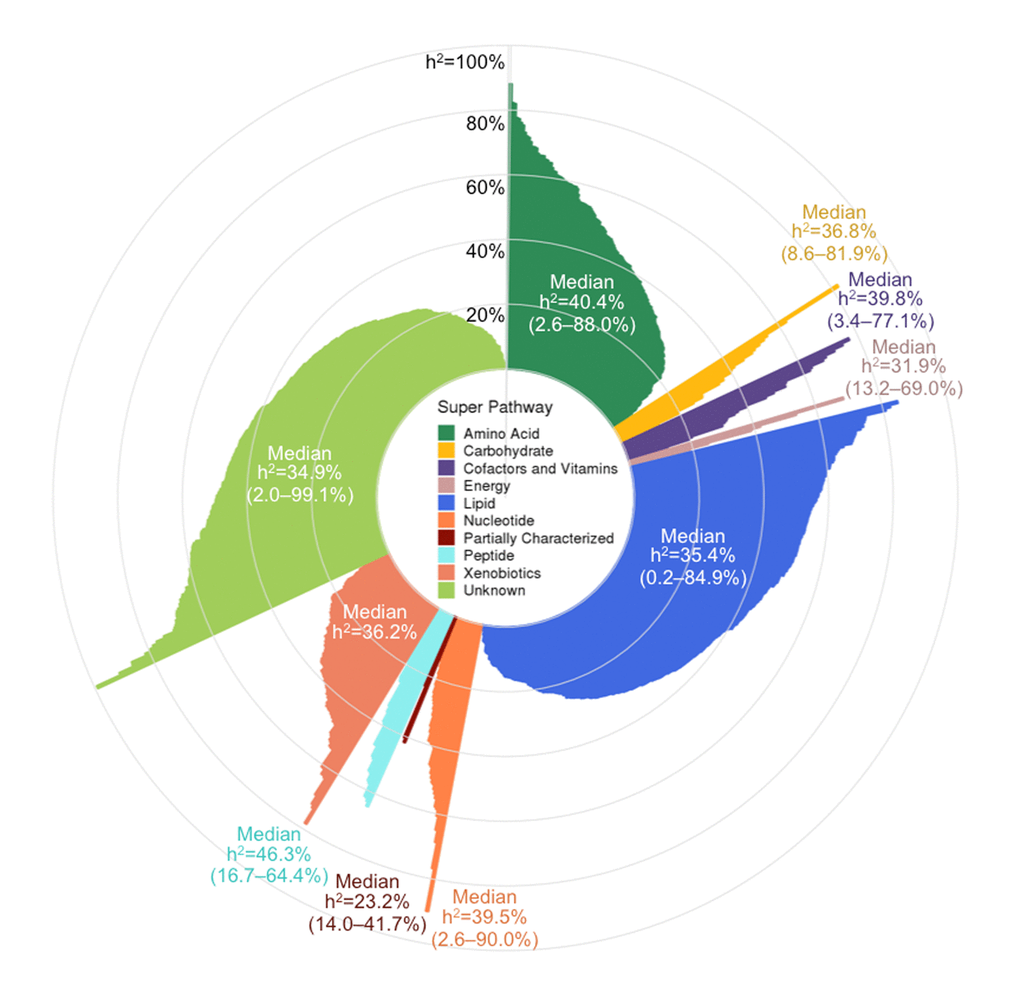
Figure 3.
Pinwheel plot of metabolite heritabilities.
Each bar indicates the heritability of the corresponding metabolite. Heritability estimates can also be found in
Table S1
.
Figure 3 — Longitudinal plasma metabolomics of aging and sex | Aging