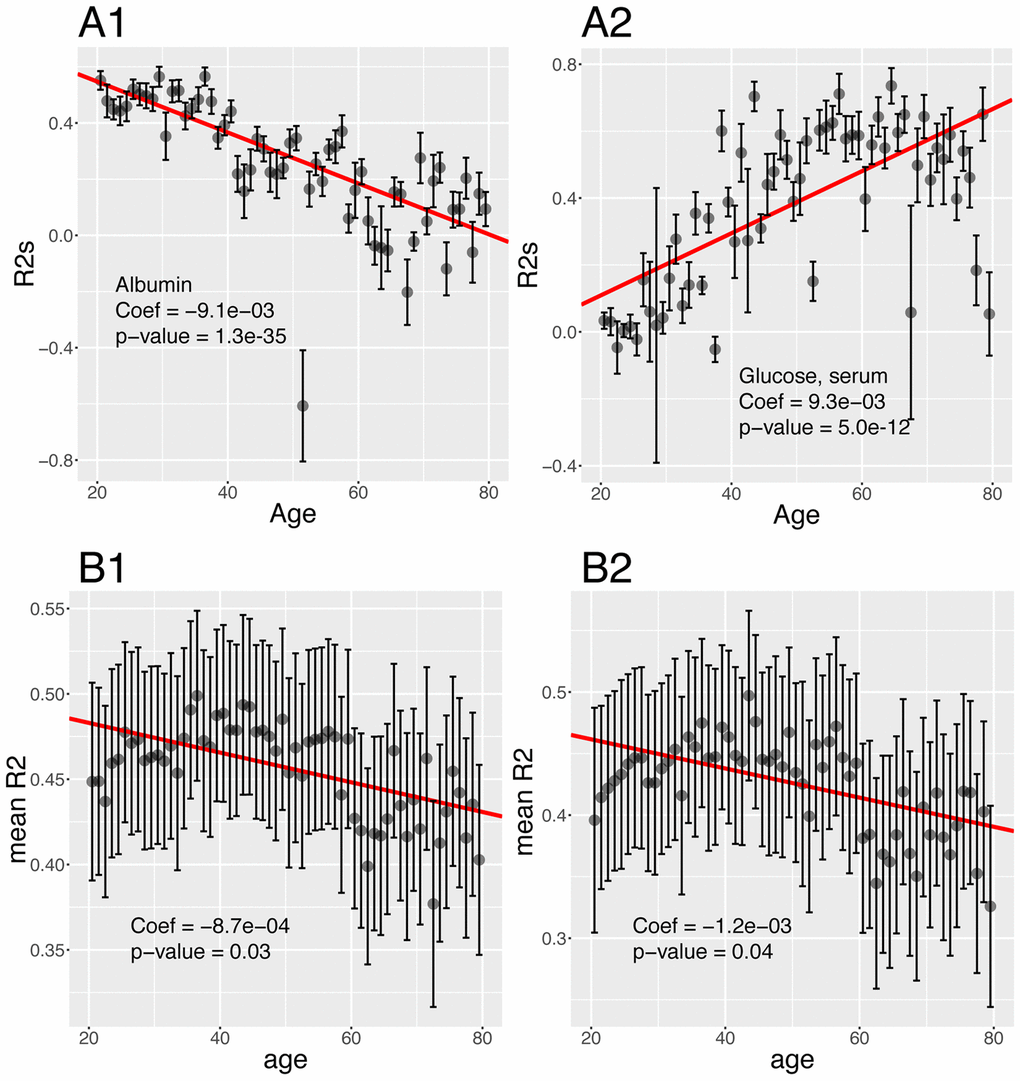
Figure 10.Changes of the predictabilities (R2) with age. (A) Predictabilities: Examples of different age trajectories. (A1) Albumin. Example of a biomarker whose predictability decreases with age. (A2) Glucose, serum. Example of a biomarker whose predictability increases with age. (B) Change of the means of the predictabilities with age. (B1) Change of the mean of all the predictabilities with age. (B2) Change of the mean of the predictabilities with age, limiting the analysis to biomarkers whose predictability significantly change with age.