Submit an Article
Navigate
Home
Editorial Board
Editorial Policies
Current Volume
Archive
Scientific Integrity
Publication Ethics Statements
Interviews with Outstanding Authors
Newsroom
Sponsored Conferences
Podcast
Contact
Special Collections
Submit an Article
Online ISSN: 1945-4589
Research Paper
|
Volume 11, Issue 5
|
pp. 1440–1456
Genetic variation underlying cognition and its relation with neurological outcomes and brain imaging
Back to article
Figure 1
(1 of 5)
−
100%
+
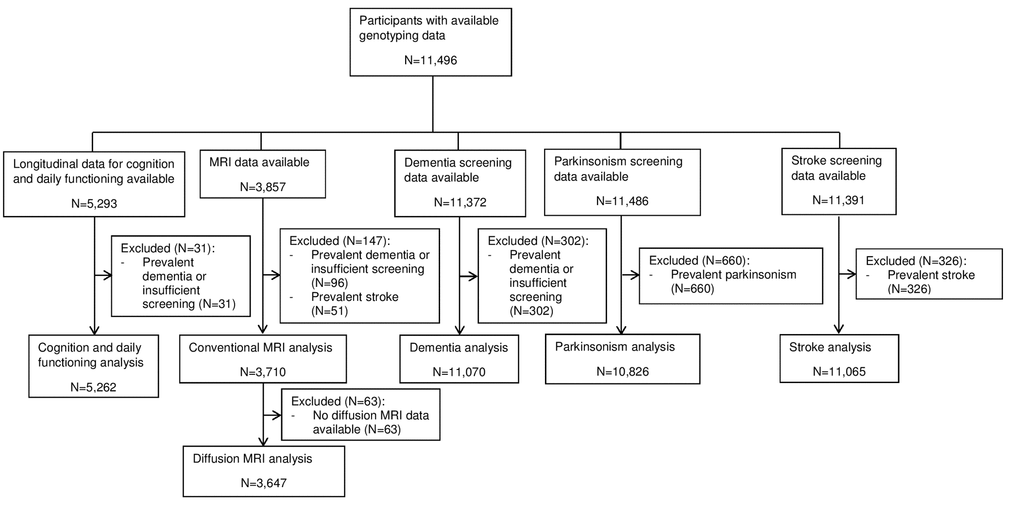
Figure 1.
Flowchart presenting the in- and exclusions of participants in the different analyses.
Abbreviations: magnetic resonance imaging (MRI).