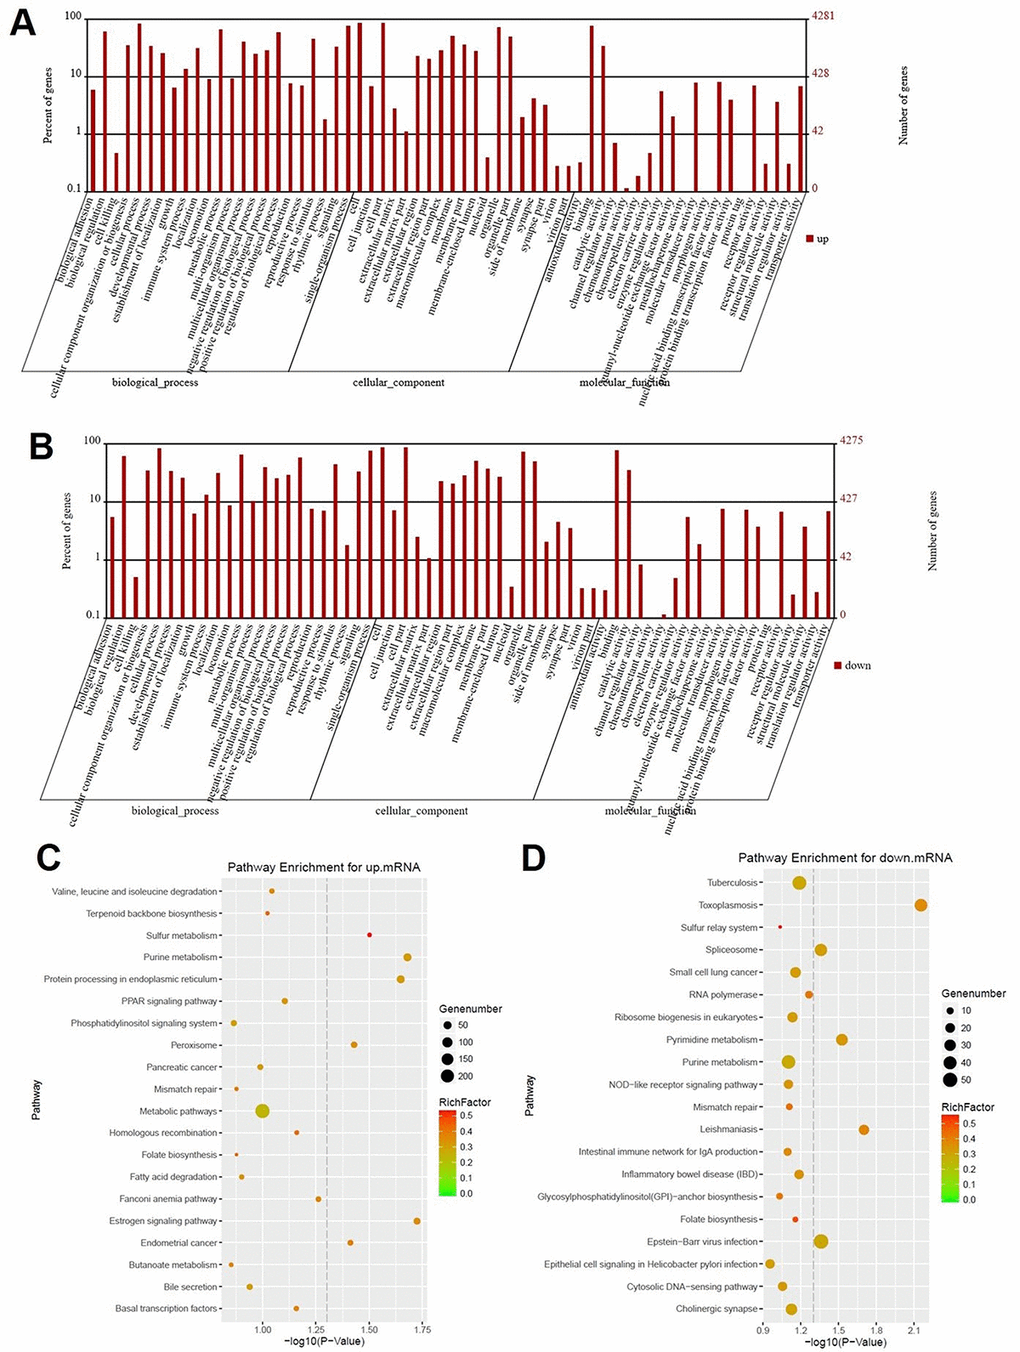
Figure 2.Signaling pathway analysis of potential DEGs. (A) The biological process, cellular component and molecular function of up-regulated genes were identified by GO analysis. (B) The biological process, cellular component and molecular function of down-regulated genes were identified by GO analysis. Items of GO analysis were listed in abscissa axis. The number of genes were recorded in vertical axis. The enriched functions with differential expression genes were picked up according to the criteria that the corrected p-value ≤ 0.05 using Benjamini method. Pathway enrichment for up-regulated mRNA (C) and down-regulated mRNA (D). Pathway enrichment was executed using KEGG tools. Degree of enrichment was shown in abscissa axis using corrected p values. The color of plot in the figure equaled to rich factor which represented the ratio of genes of the pathway in all the genes of the pathway.