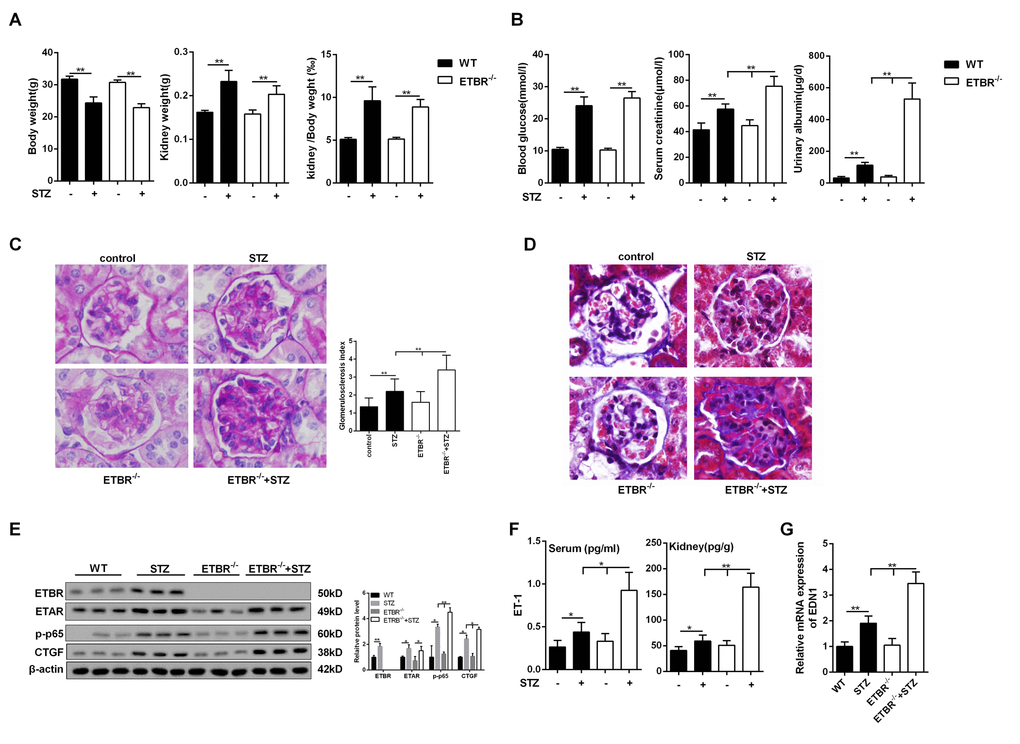
Figure 2.Severer diabetic nephropathy in ETBR-/- mice. (A) Body weight and kidney weight were detected in control mice (WT), STZ-diabetic mice, ETBR-/- mice and STZ-diabetic ETBR-/- mice. **p<0.01, compared with control. N=5. (B) Serum glucose level, serum creatinine level and urinary albumin level were measure in control mice (WT), STZ-diabetic mice, ETBR-/- mice and STZ-diabetic ETBR-/- mice. **p<0.01, compared with control or STZ-diabetic WT mice. (C) Periodic acid-Schiff (PAS) staining of kidney tissues from control mice, STZ-diabetic WT mice, ETBR-/- mice, and STZ-diabetic ETBR-/- mice. **p<0.01, compared with control, STZ-diabetic WT, or ETBR-/- mice. 1000×magnification. (D) MASSON staining of of kidney tissues from control mice, STZ-diabetic WT mice, ETBR-/- mice, and STZ-diabetic ETBR-/- mice. 1000×magnification. (E) Protein levels of ECM-related protein CTGF and p-p65 in control mice, STZ-diabetic WT mice, ETBR-/- mice, and STZ-diabetic ETBR-/- mice. *p<0.05, compared with WT, ETBR-/-, or STZ mice. **p<0.01, compared with WT, ETBR-/-, or STZ mice. N=3. (F-G) Serum ET-1/kidney ET-1 expressions and transcriptional level of EDN1 from kidney were detected in control mice, STZ-diabetic WT mice, ETBR-/- mice, and STZ-diabetic ETBR-/- mice. *p<0.05, **p<0.01, compared with WT, ETBR-/-, or STZ mice. Bars depict the mean ± SD. N=5.