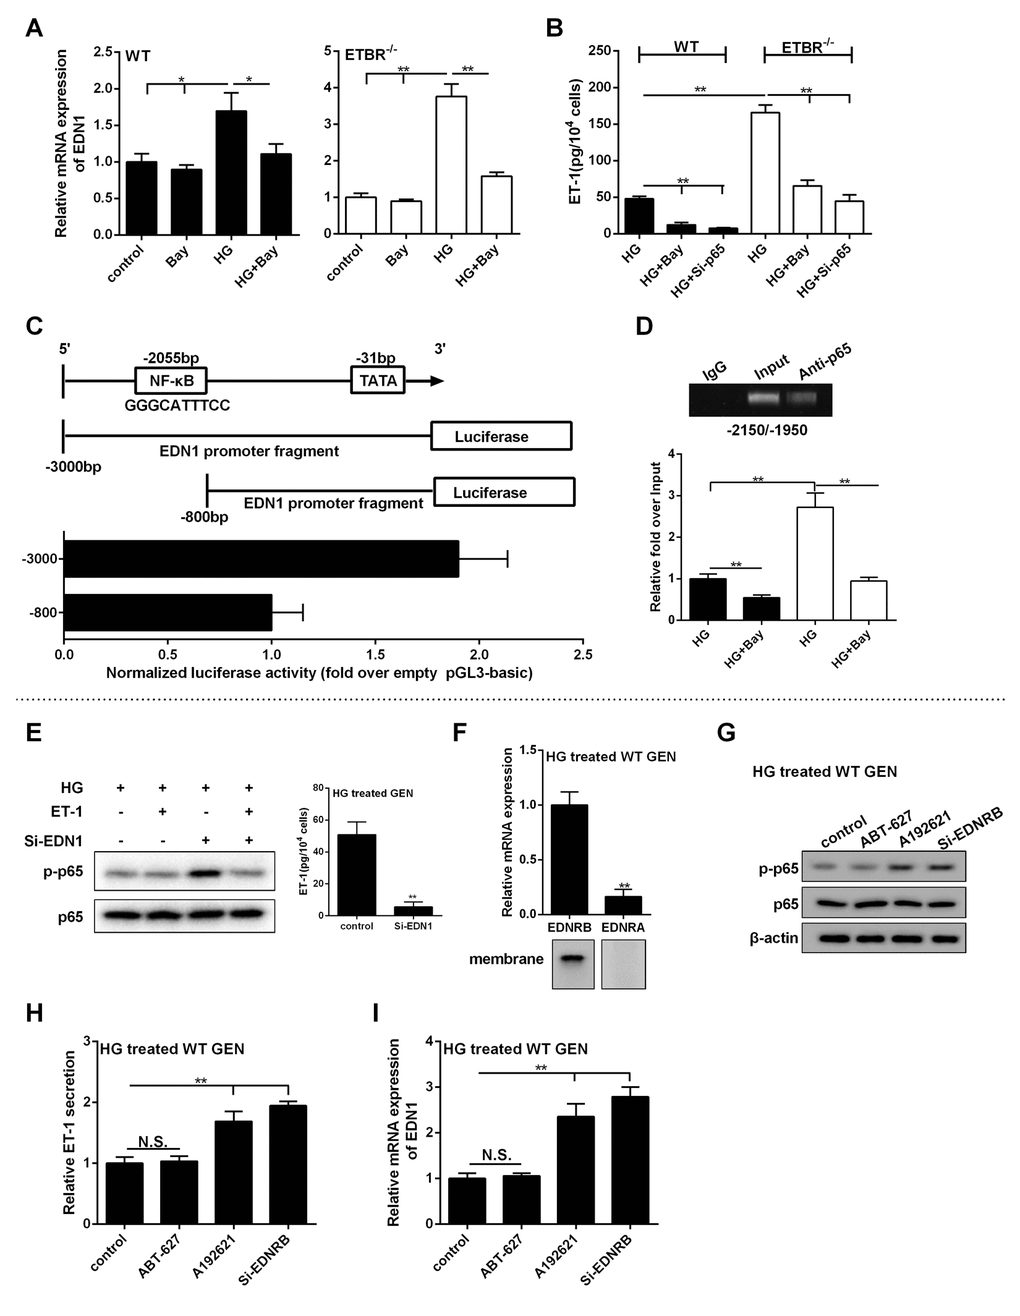
Figure 7.p65 promoted the transcription of EDN1, and ET-1/ETBR modulated ET-1 through NF-kappaB. (A) WT GENs or ETBR-/- GENs were treated with HG or 10 μM Bay or HG+10 μM Bay for 24 h. mRNA expressions of EDN1 in WT or ETBR-/- GENs were detected in control, Bay, HG, HG+Bay groups. *p<0.05, compared with control, Bay, or HG group. **p<0.01, compared with control, Bay, or HG group. (B) Extracellular secretion of ET-1 was detected in HG, HG+Bay and HG+si-p65 groups. **p<0.01, compared with HG or HG+Bay group. (C) CHO cells were co-transfected with p65-expressing vector and pGL3 vector carrying different promoters of EDN1, and empty pGL3 basic was used as control. After 48 h of transfection, EDN1 promoter activity was detected by dual-Luciferase Reporter Assay System. (D) WT or ETBR-/- GENs were treated with HG or HG+10 μM Bay for 24 h. ChIP assay showed p65 could bind with the segments at this region in HG-treated GENs. Under HG condition, inhibition of NF-kappaB significantly decreased the binding efficiency of this region. **p<0.01, compared with HG group. (E) After GENs treated with HG for 6 h, 1 nM ET-1 was added into GENs and cultured for 18 h. So, GENs was treated with HG for 24 h in total. ET-1 secretion in GENs was detected in control and si-EDN1 group. p-p65 expression was detected in HG group, HG+ET-1 group, HG+si-EDN1 group, and HG+ET-1+si-EDN1 group. **p<0.01, compared with control group. (F) After WT GENs treated with HG for 24 h, mRNA level of ETAR and ETBR were detected in HG treated WT GENs. ETAR and ETBR protein levels were detected in the membrane of WT GENs. **p<0.01, compared with ETBR. (G-I) WT GENs were treated with HG, ABT-627 (25 μM), or A192621 (25 μM) for 24 h. Or WT GENs were transfected with 100 nM si-ETBR, then treated with HG for 24 h. p-p65 and p65 protein levels, ET-1 secretion level and EDN1 mRNA expression were detected in control, ABT-627, A192621 and si-ETBR groups.**p<0.01, compared with control or A192621 group. Bars depict the mean ± SD. N=3.