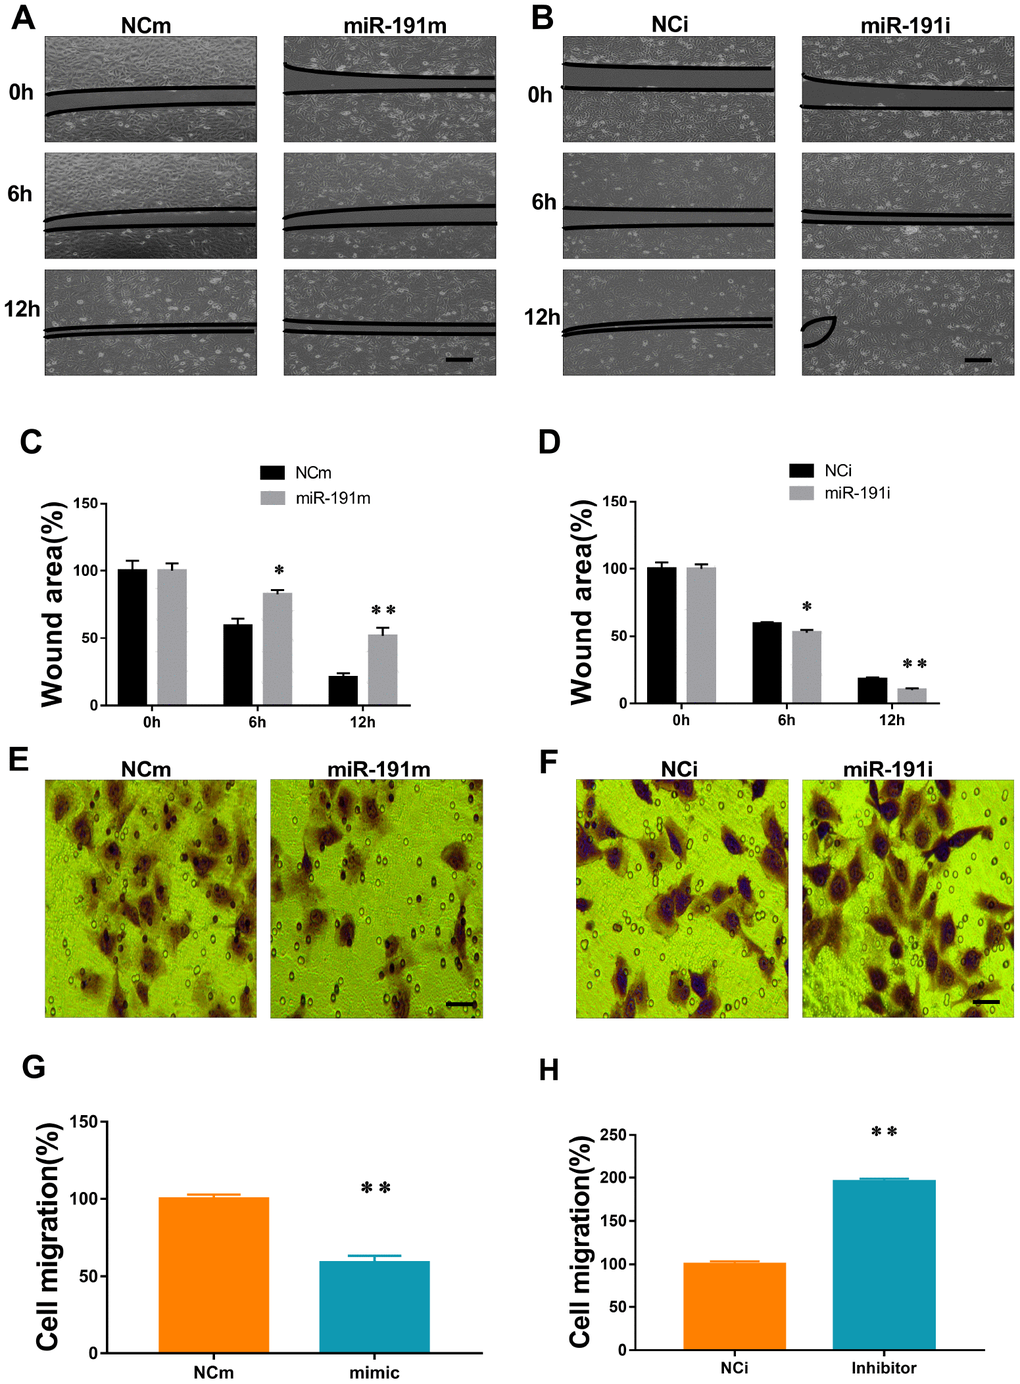
Figure 4.MiR-191 inhibited cell migration. (A, B) Phase contrast microscopic images of HUVECs at 0, 6, and 12 h after scratching. The cells were transfected with miR-191 mimic (A), miR-191 inhibitor (B), or the corresponding scrambled NCm (A) and NCi (B). Black lines indicate the wound area. Scale bars, 100 μm. (C, D) Size of wound area (percentage of 0 h) created by scratching HUVECs transfected with miR-191 mimic (C) or miR-191 inhibitor (D) (n =6 per group). (E, F) Phase contrast microscopic images of HUVECs migrated and attached to the bottom membrane of a transwell. The cells were transfected with miR-191 mimic (E), miR-191 inhibitor (F), or the corresponding scrambled NCm (E) and NCi (F). Scale bars, 20μm. (G, H) Number of migrated HUVECs (percentage of NCm or NCi) transfected with miR-191 mimic (G) or miR-191 inhibitor (H) (n =6 per group). Means ± SEM. * P< 0.05,** P< 0.01 vs. NCm or NCi.