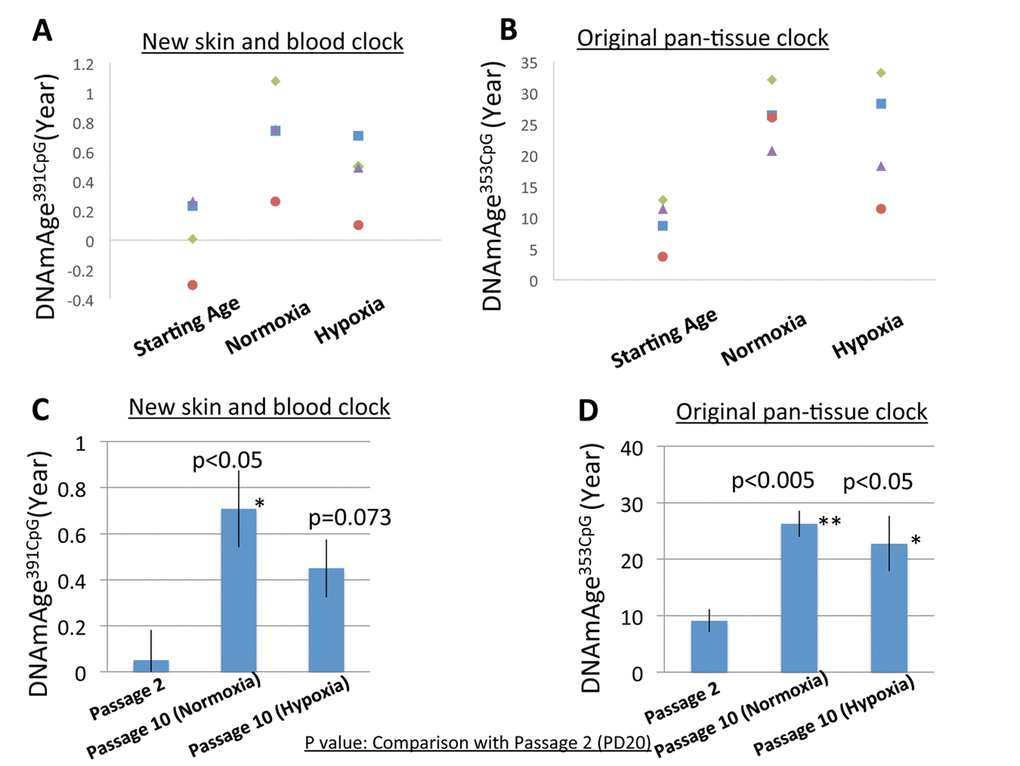
Figure 3.DNAm age progression in normoxia and hypoxia. (A and B) The DNAm age of each cell line at early PD (19-20) (passage 2) and accumulated PD (42.3-51.5) (passage 10) is shown. The DNAm age of the same cell line is shown by the same color. Results for DNAmAge391CpG (A) and DNAmAge353CpG (B) are shown. Each dot is the average of a duplicate DNAm analysis for each condition. (C and D) The average DNAm ages of 4 cell lines at passage 2, passage 10 (Normoxia), and passage 10 (Hypoxia) are shown (n=4). Results for DNAmAge391CpG (C) and DNAmAge353CpG (D) are shown. The P values on the figure show the statistical comparison with the data at passage 20. *p<0.05, **p<0.005 (t-test).