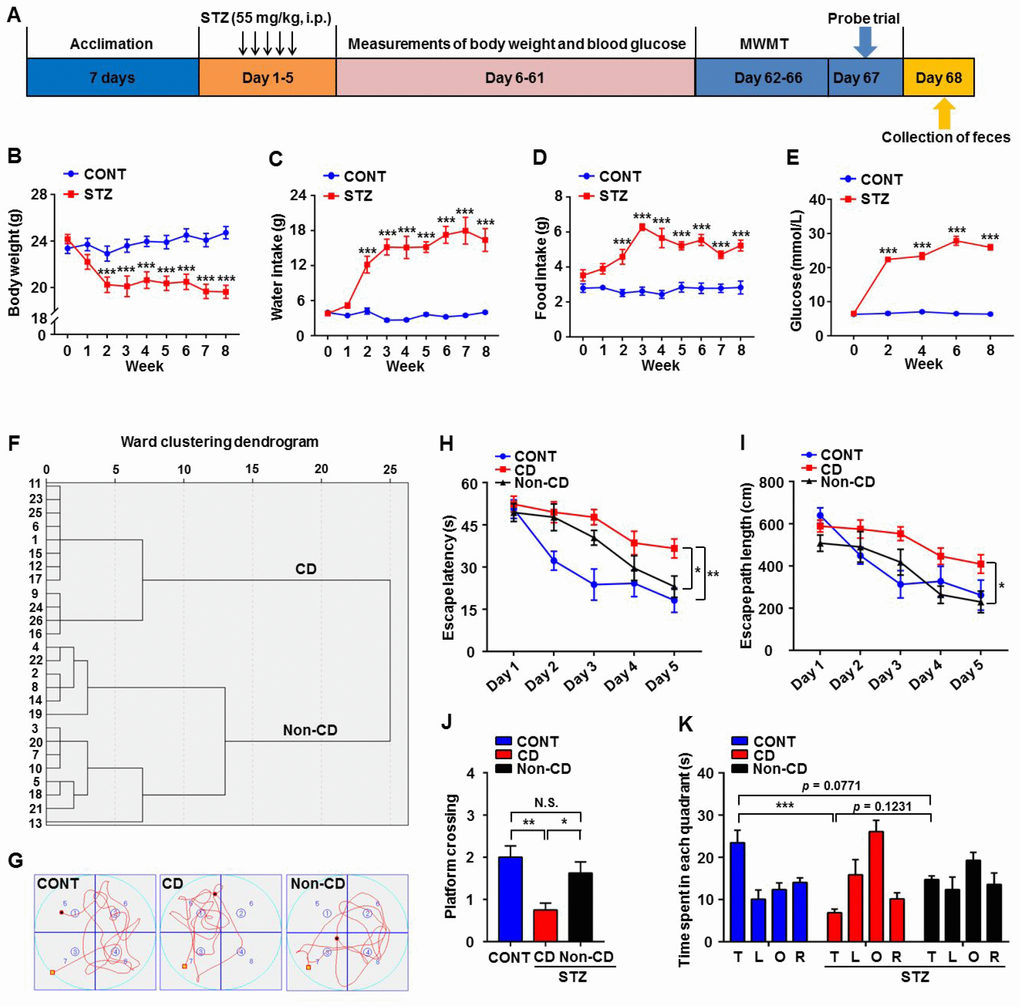
Figure 1.Comparisons of Morris water maze performance among control (CONT), diabetic cognitive dysfunction (CD), and diabetic Non-CD mouse groups. (A) The schedule of the present study. At 7 days after acclimation, mice were intraperitoneally injected with STZ (55 mg/kg) for 5 consecutive days to induce diabetes or with vehicle as a control. Body weight, water and food intake, and blood glucose levels were measured from day 6 to 61. Mice were scheduled for MWM training (4 trials per day) from day 62 to 66 post-STZ, and the probe trial was performed on day 67. On day 68, fecal samples were collected for 16S rRNA gene sequencing. (B) Body weight (two-way ANOVA; Time: F8,56 = 8.446, p < 0.001; Group: F1,7 = 20.46, p < 0.01; Time × Group Interaction: F8,56 = 12.34, p < 0.001). (C) Water intake (two-way ANOVA; Time: F8,56 = 17.48, p < 0.001; Group: F1,7 = 105.1, p < 0.001; Interaction: F8,56 = 19.67, p < 0.001). (D) Food intake (two-way ANOVA; Time: F8,56 = 5.254, p < 0.001; Group: F1,7 = 108.4, p < 0.001; Interaction: F8,56 = 5.755, p < 0.001). (E) Blood glucose levels (two-way ANOVA; Time: F4,28 = 66.98, p < 0.001; Group: F1,7 = 2376, p < 0.001; Interaction: F4,28 = 79.15, p < 0.001). (F) Dendrogram of hierarchical clustering analysis. A total of 26 mice confirmed as diabetic following STZ injection were divided into CD and Non-CD groups according to MWM performance indices using hierarchical clustering analysis. (G) Representative trace graphs of CONT, CD, and Non-CD group swim paths in the MWM. (H) Escape latency (two-way ANOVA; Time: F4,28 = 23.09, p < 0.001; Group: F2,14 = 14.84, p < 0.001; Interaction: F8,56 = 1.57, p > 0.05). (I) Escape path length (two-way ANOVA; Time: F4,28 = 14.36, p < 0.001; Group: F2,14 = 15.74, p < 0.001; Interaction: F8,56 = 1.292, p > 0.05). (J) Platform crossings (one-way ANOVA; F2,21 = 7.373, p < 0.01). (K) Time spent in each quadrant (two-way ANOVA; Time: F3,21 = 5.917, p < 0.01; Group: F2,14 = 0.9345, p > 0.05; Interaction: F6,42 = 5.618, p < 0.001). Data are shown as mean ± SEM (n = 8−10 mice/group). *P < 0.05, **P < 0.01 or ***P < 0.001. ANOVA: analysis of variance; CD: cognitive dysfunction; CONT: control; MWM: Morris water maze; N.S.: not significant; SEM: standard error of the mean; STZ: streptozotocin.