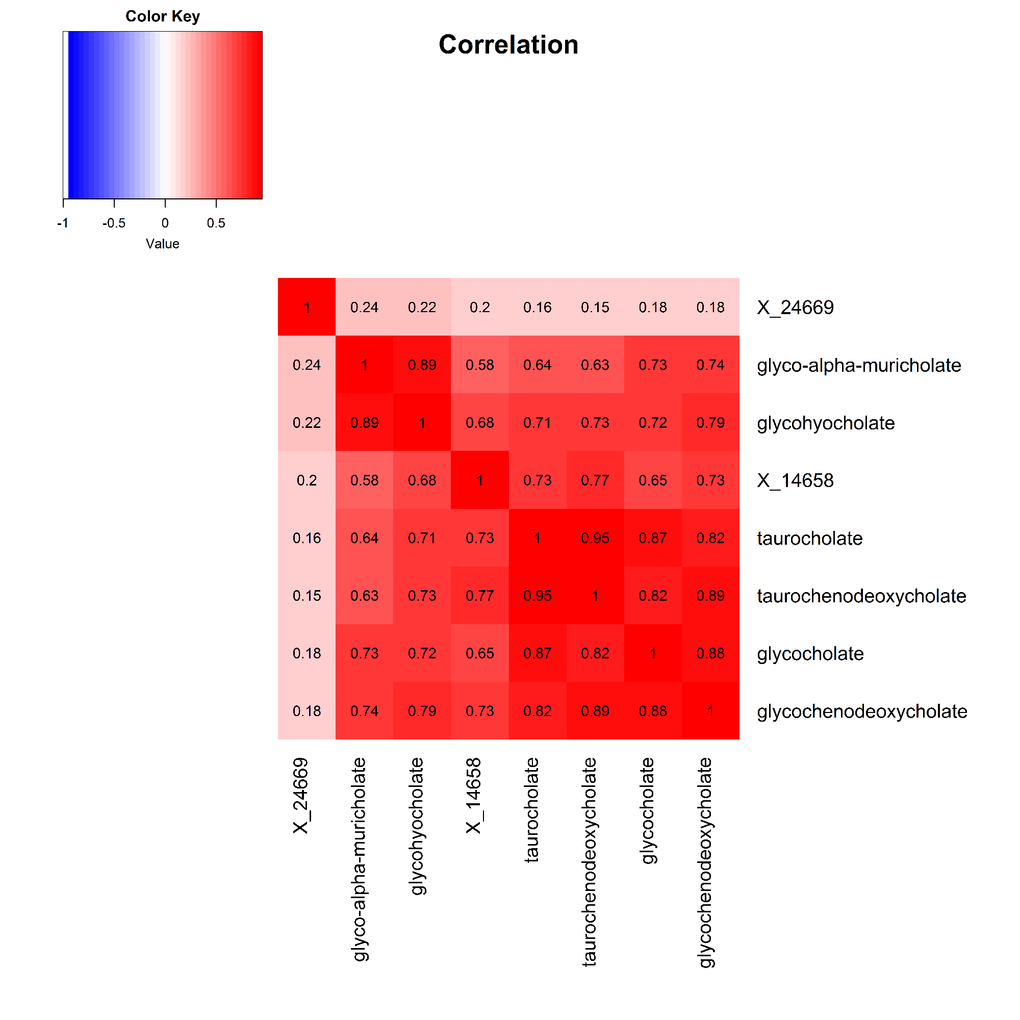
Figure 4.Heat map displaying pairwise correlation coefficients for the network of metabolites representing the significant primary and secondary bile acid metabolism pathway.
Figure 4 — Novel serum metabolites associate with cognition phenotypes among Bogalusa Heart Study participants | Aging