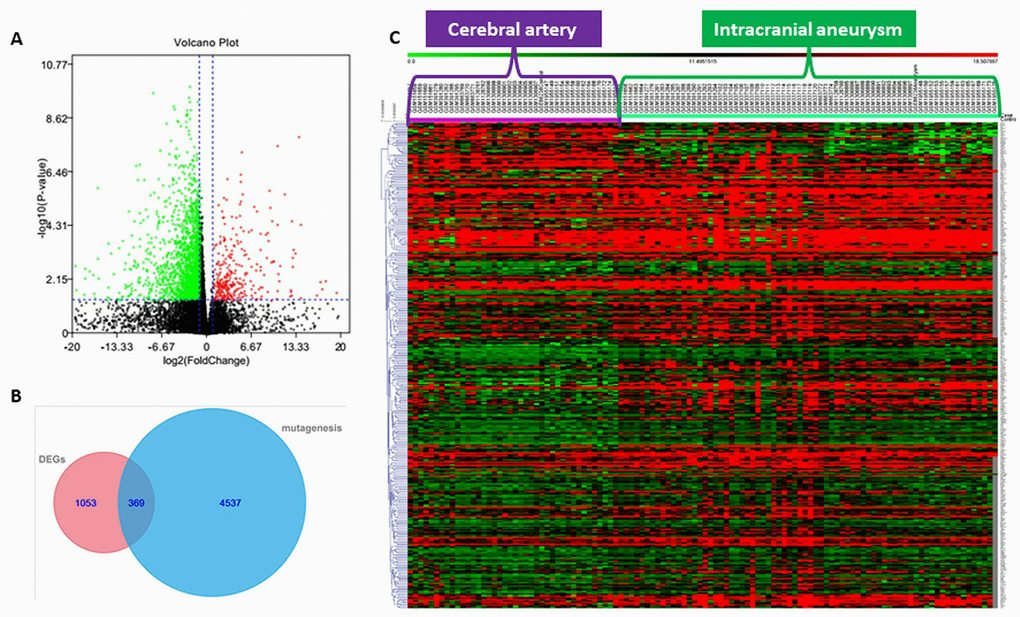
Figure 2.(A) Volcano plot of significantly up-regulated (red) and down-regulated (green) DEGs. (B) Venn diagram showing the number of genes from next-generation sequencing (NGS) that were considered mutant (mutagenesis), the number of genes from transcriptome sequencing data in the GEO database considered differentially expressed genes (DEGs), and the number of genes common to the NGS and transcriptome sequencing datasets. (C) Heat map showing expression of genes overlapping between the NGS and transcriptome sequencing datasets.