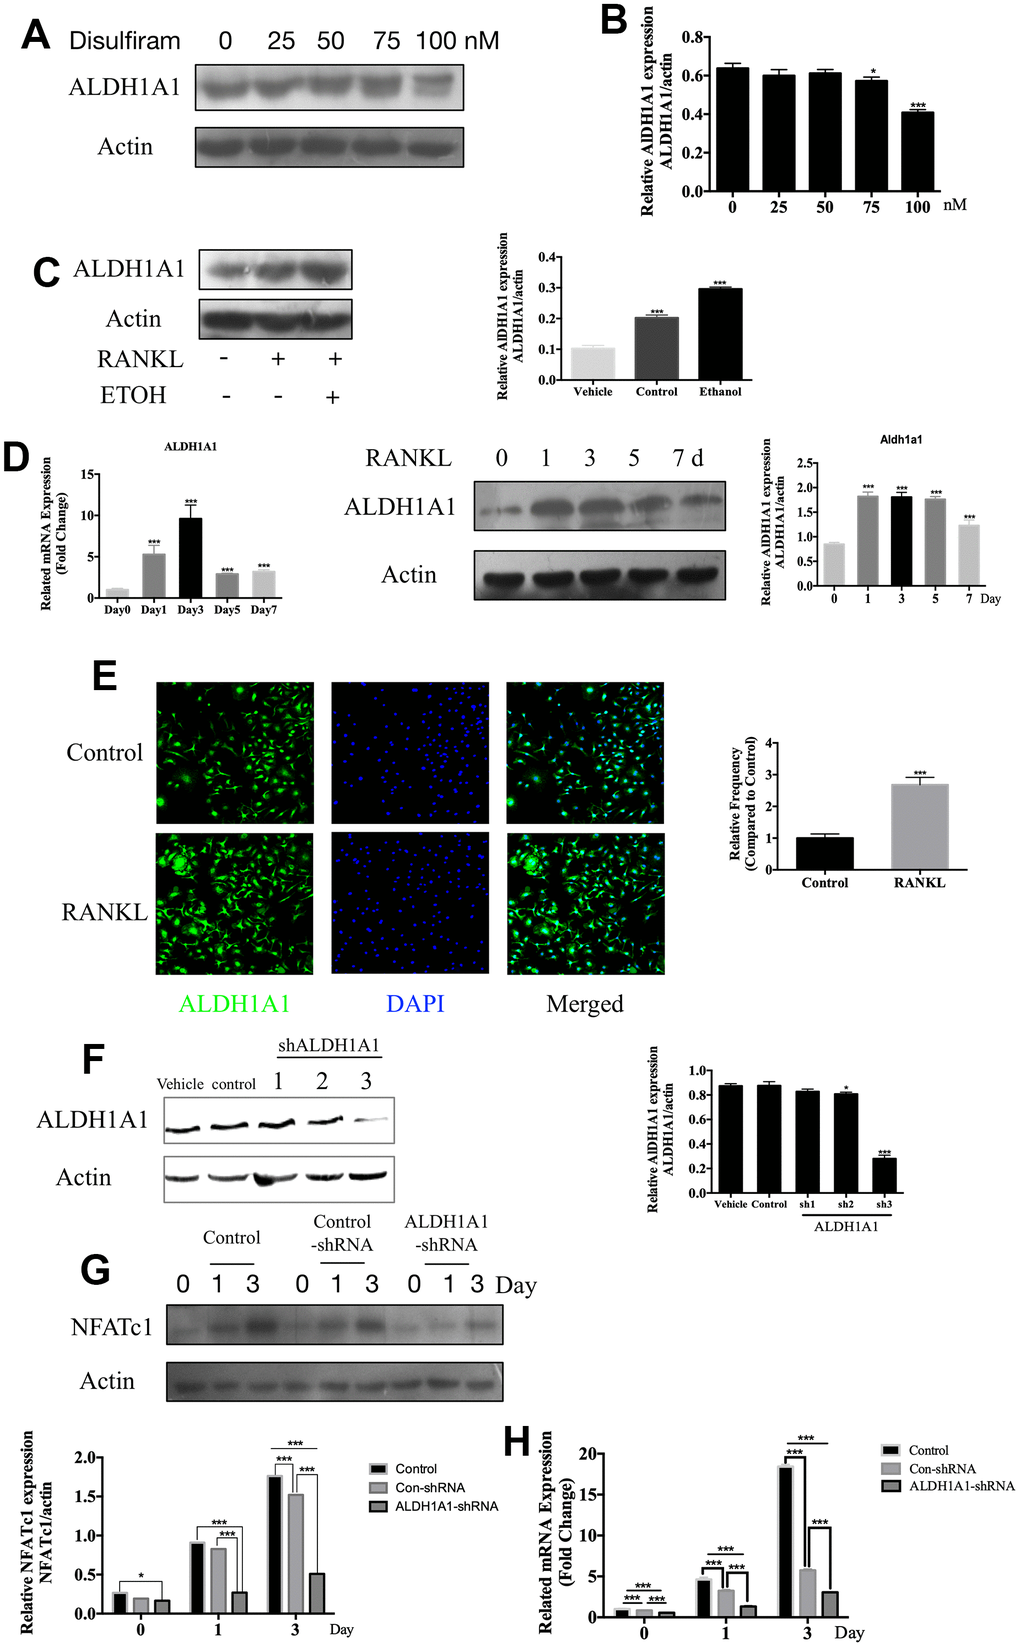
Figure 3.Disulfiram inhibits ethanol-induced osteoclastogenesis via ALDH1A1. (A) Disulfiram inhibited the expression ALDH1A1 in a dose-dependent manner. (B) Relative expression of ALDH1A1 was determined by densitometric analysis of each band and expressed as a ratio to that of β-actin using ImageJ software. (C) Ethanol increased the expression of ALDH1A1. Total cellular proteins were extracted from BMM-derived OCs treated with 100 ng/mL RANKL, with or without ethanol, for 3 days. Relative expression of ALDH1A1 was determined by densitometric analysis of each band and expressed as a ratio to that of β-actin using ImageJ software. (D) qPCR was used to measure the relative levels of ALDH1A1 expression, normalized to those of β-actin, at different times of osteoclastogenesis (n = 3). Values are the mean ± SD. *p < 0.05, **p < 0.01, ***p < 0.001. Western blotting was used to measure the relative levels of ALDH1A1 expression at different times of osteoclastogenesis. Total cellular proteins were extracted from BMM-derived OCs treated with RANKL for 0, 1, 3, 5, and 7 days. (E) Representative immunofluorescence images of ALDH1A1 from BMMs treated with or without RANKL, showing that RANKL increased ALDH1A1 in the cytoplasm and the nucleus. Nuclei were counterstained with DAPI (blue). (F) Efficiency of ALDH1A1 silencing was determined by immunoblot analysis. Relative expression of ALDH1A1 was determined by densitometric analysis of each band and expressed as a ratio to that of β-actin using ImageJ software. (G) Silencing of ALDH1A1 decreased the expression of NFATc1. Total cellular proteins were extracted from RAW 264.7 cells and RAW 264.7 cells transfected with Lenti-ALDH1A1 or Lenti-NC, after co-treatment with RANKL for 0, 1, and 3 days. (H) qPCR was used to measure the relative expression levels of ALDH1A1, normalized to those of β-actin (n = 3). Values are the mean ± SD. *p < 0.05, **p < 0.01, ***p < 0.001.