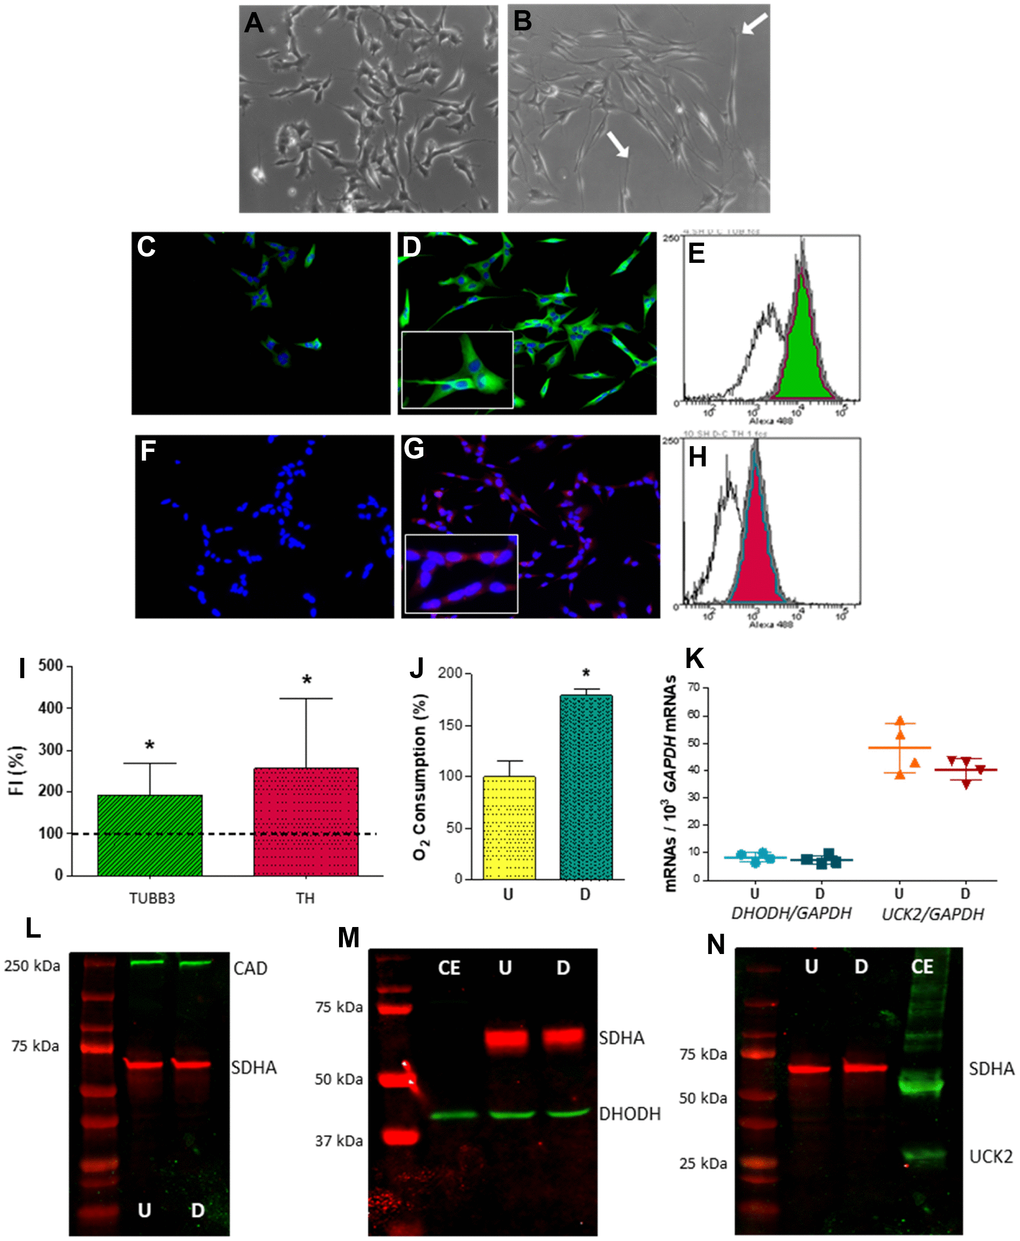
Figure 2.Expression of selected genes from pyrimidine nucleotide synthesis pathways in human neuroblastoma SH-SY5Y cells. (A, B) Representative optic microscopy images of (A) undifferentiated and (B) neuron-differentiated SH-SY5Y cells. White arrows point to neurites. (C, D) Representative immunofluorescence microscopy images of anti-TUBB3 stained (C) undifferentiated and (D) neuron-differentiated SH-SY5Y cells. Inset: enlarged figure detail. (E) Representative image of a flow cytometry histogram of anti-TUBB3 stained undifferentiated (white) and neuron-differentiated (green) cells. (F, G) Representative immunofluorescence microscopy images of anti-TH stained (F) undifferentiated and (G) neuron-differentiated SH-SY5Y cells. Inset: enlarged figure detail. (H) Representative image of a flow cytometry histogram of anti-TH stained undifferentiated (white) and neuron-differentiated (red) cells. (I) Graph showing the change of fluorescence intensity (FI) in TUBB3 and TH levels after neuronal differentiation. Dashed line (100 %) represents TUBB3 or TH mean values of undifferentiated cells. Bars indicate mean values and standard deviations in differentiated cells. N = 11. *: p < 0.05 (versus undifferentiated cells). (J) Oxygen consumption of (U) undifferentiated and (D) neuron-differentiated cells. N = 3. *: p < 0.05 (versus undifferentiated cells). (K) DHODH and UCK2 mRNA levels in (U) undifferentiated and (D) neuron-differentiated cells. Points represent individual samples and horizontal lines indicate mean ± standard deviation values. N = 4. (L–N) Representative images of western blots for (L) CAD (N = 2), (M) DHODH (N = 3) and (N) UCK2 (N = 2) proteins. CE, commercial enzyme; SDHA, succinate dehydrogenase subunit A. 70 μg of cell protein was used in these western blots (L–N).