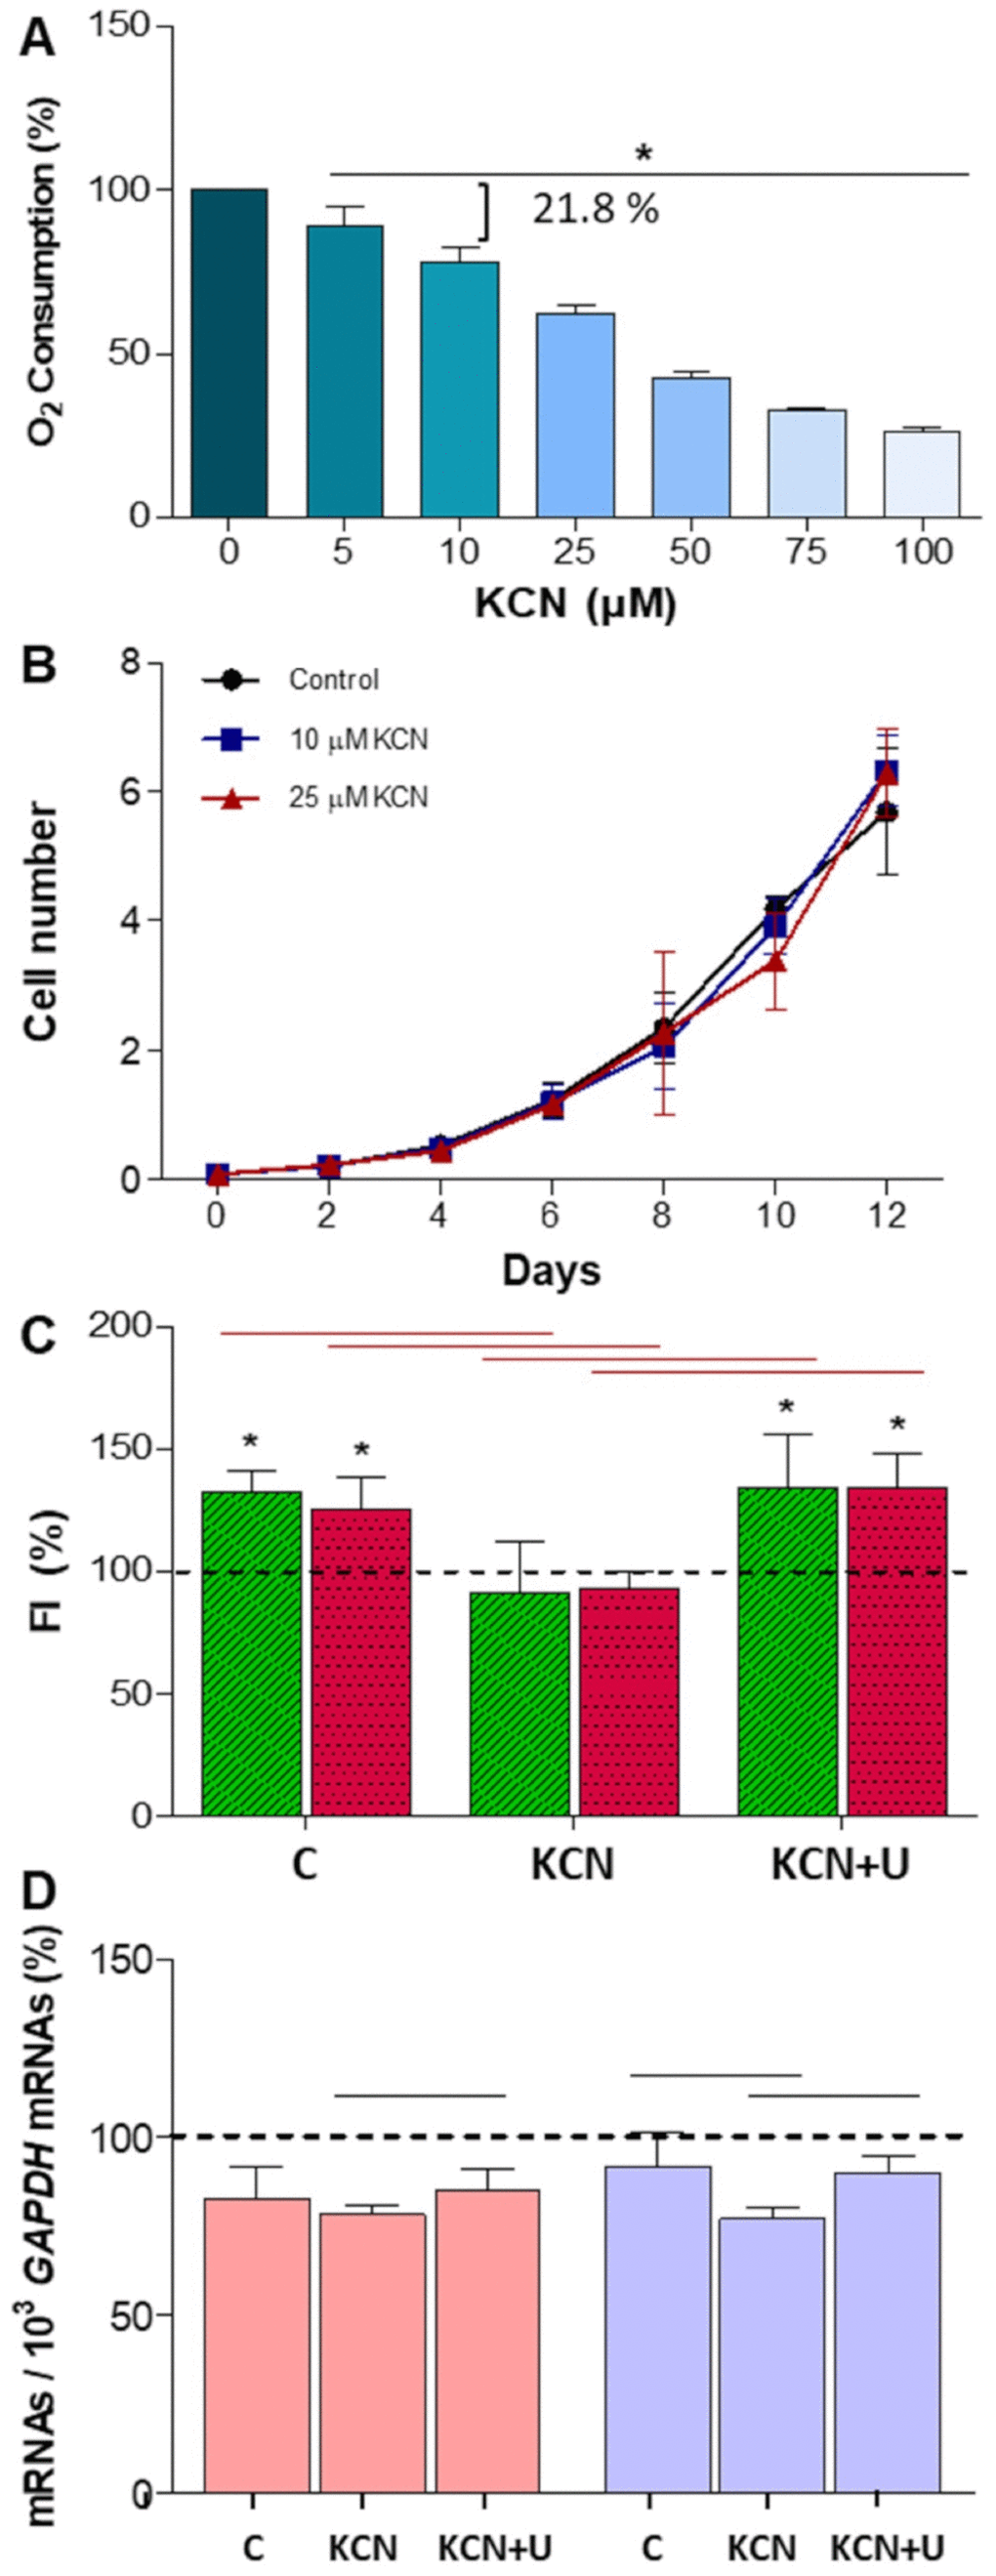
Figure 4.Potassium cyanide (KCN) effect on neuroblastoma SH-SY5Y cells. N ≥ 3. (A) Oxygen consumption in proliferating SH-SY5Y cells at increasing KCN concentrations. *: p < 0.05, versus untreated cells. (B) Cell proliferation (in million cells) without KCN (control) and at 10 or 25 μM KCN. (C) TUBB3 (green) and TH (red) fluorescence intensity (FI) mean and standard deviation values in neuron-differentiated cells. Dashed line (100 %) represents TUBB3 or TH mean values of undifferentiated cells. *: p < 0.05, versus undifferentiated cells. Horizontal red lines indicate p values ≤ 0.0004 between control untreated neuron-differentiated cells (C), KCN-treated neuron-differentiated cells (KCN) and KCN plus uridine-treated neuron-differentiated cells (KCN+U), as indicated. (D) DHODH (pink) and UCK2 (purple) mRNA mean and standard deviation values in C, KCN and KCN+U neuron-differentiated cells. Dashed line (100 %) represents DHODH and UCK2 mRNA mean values of undifferentiated cells. Black horizontal lines indicate p values < 0.05 between groups as indicated.