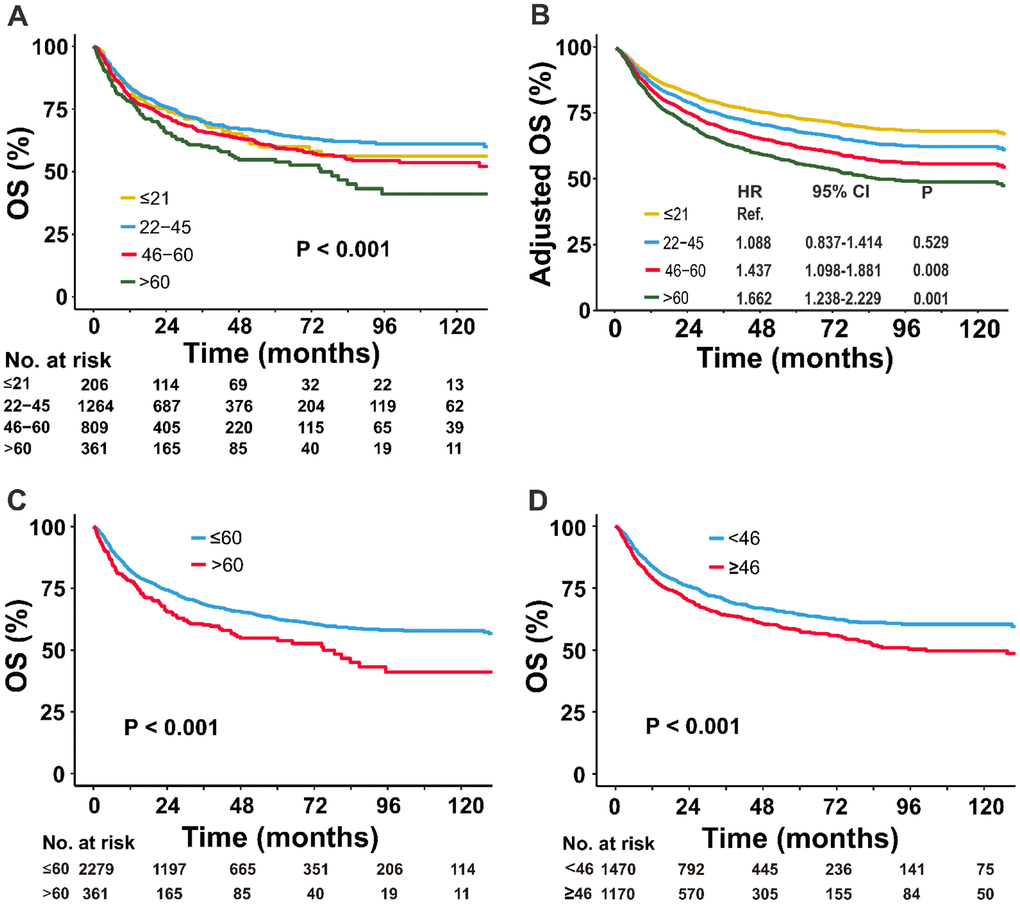
Figure 3.Comparison of OS between the different age groups. (A) Univariate and (B) multivariate analyses of the OS of patients stratified by age into four groups; (C) univariate analysis of the OS of patients stratified by age into two groups: ≤60 versus >60 years; and (D) <46 versus ≥46 years. OS, overall survival.