Submit an Article
Navigate
Home
Editorial Board
Editorial Policies
Current Volume
Archive
Scientific Integrity
Publication Ethics Statements
Interviews with Outstanding Authors
Newsroom
Sponsored Conferences
Podcast
Contact
Special Collections
Submit an Article
Online ISSN: 1945-4589
Research Paper
|
Volume 11, Issue 19
|
pp. 8681–8700
The prognostic value of YAP1 on clinical outcomes in human cancers
Back to article
Figure 5
(5 of 6)
−
100%
+
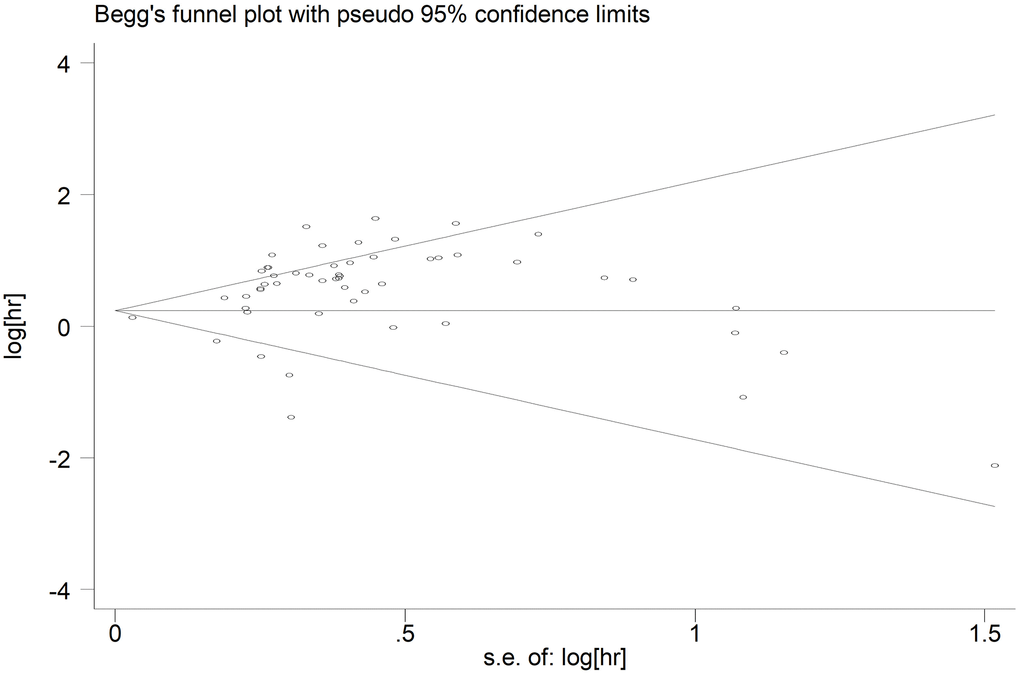
Figure 5.
Begg’s funnel plot of publication bias for included studies reporting OS.
Abbreviations: HR hazard ratio; OS overall analysis; SE standard error.
Figure 5 — The prognostic value of YAP1 on clinical outcomes in human cancers | Aging