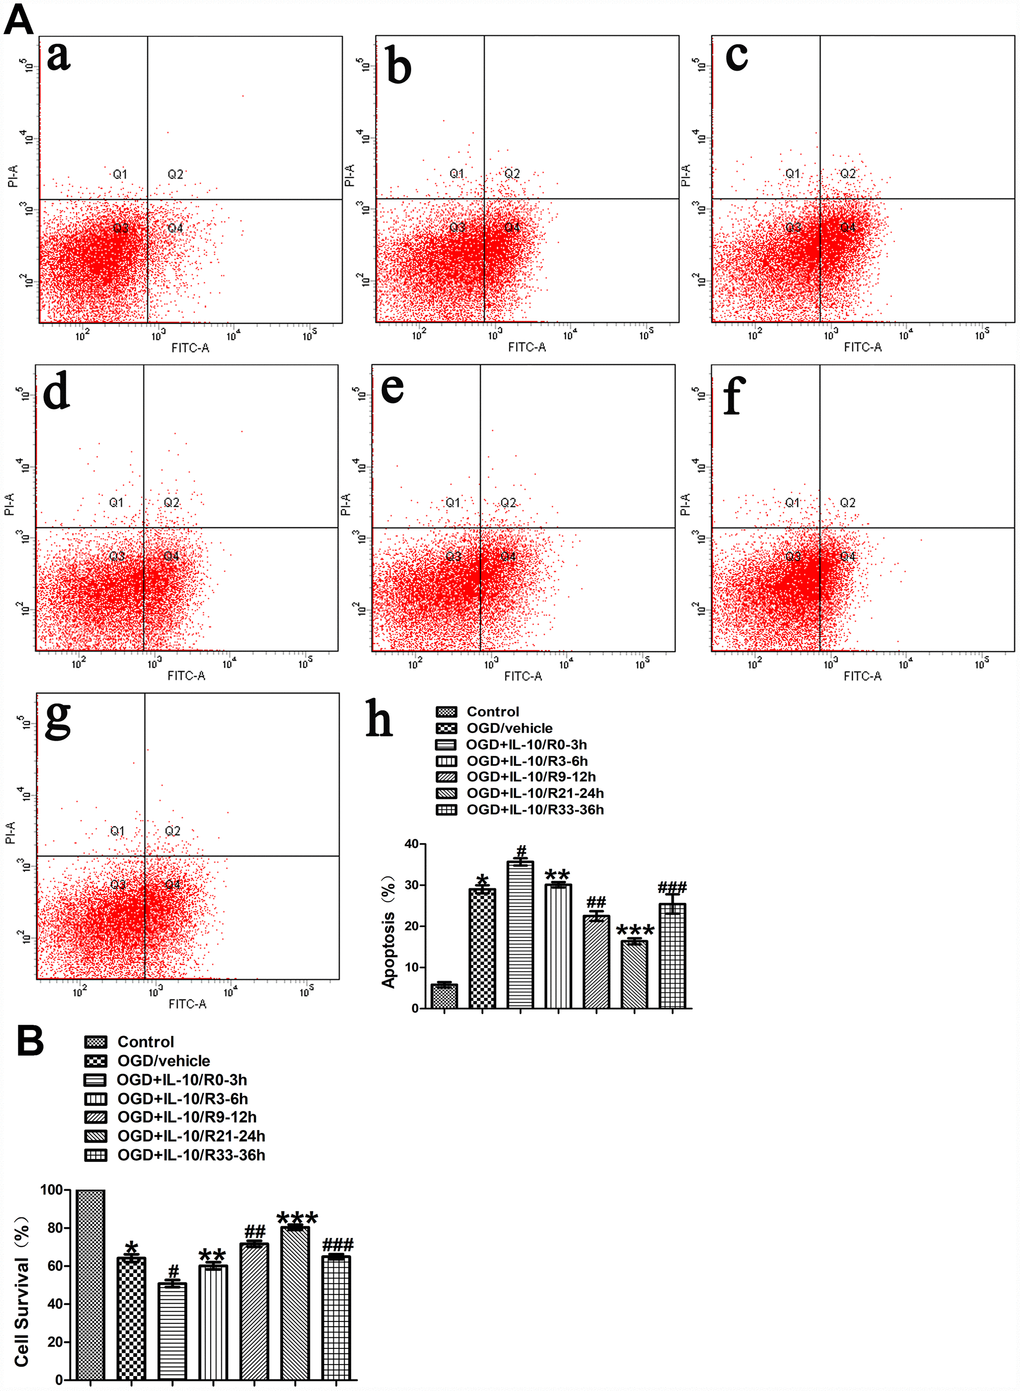
Figure 2.The effect of IL-10 on OGD-induced apoptosis in cultured primary cortical neurons at different time points after OGD injury. (A) Forty-eight hours after OGD, the apoptosis of neurons was detected by flow cytometry. The signals from apoptotic neurons were localized in the Q2 and Q4 quadrants of the resulted dot-plot graph. (a) Control group; (b) OGD group; (c) OGD+IL-10/R0-3h group; (d) OGD+IL-10/R3-6h; (e) OGD+IL-10/R9-12h; (f) OGD+IL-10/R21-24h; (g) OGD+IL-10/R33-36h; (h) Statistical graph of apoptosis in different groups (n=3). *p<0.001, as compared with Control group; #p<0.01, as compared with OGD group; **p>0.05, as compared with OGD group; ##p<0.01, as compared with OGD group; ***p<0.001, as compared with OGD group; ###p>0.05, as compared with OGD group; by one way analysis of variance (ANOVA) followed by Student-Newman-Keuls multiple comparison test, F=69.591, p<0.0001. (B) Forty-eight hours after OGD, survival of neurons was detected by MTT. Statistical graph of cell survival in different groups (n=3). *p<0.001, as compared with Control group; #p<0.001, as compared with OGD group; **p>0.05, as compared with OGD group; ##p<0.05, as compared with OGD group; ***p<0.001, as compared with OGD group; ###p>0.05, as compared with OGD group; by one way analysis of variance (ANOVA) followed by Student-Newman-Keuls multiple comparison test, F=102.550, p<0.0001.