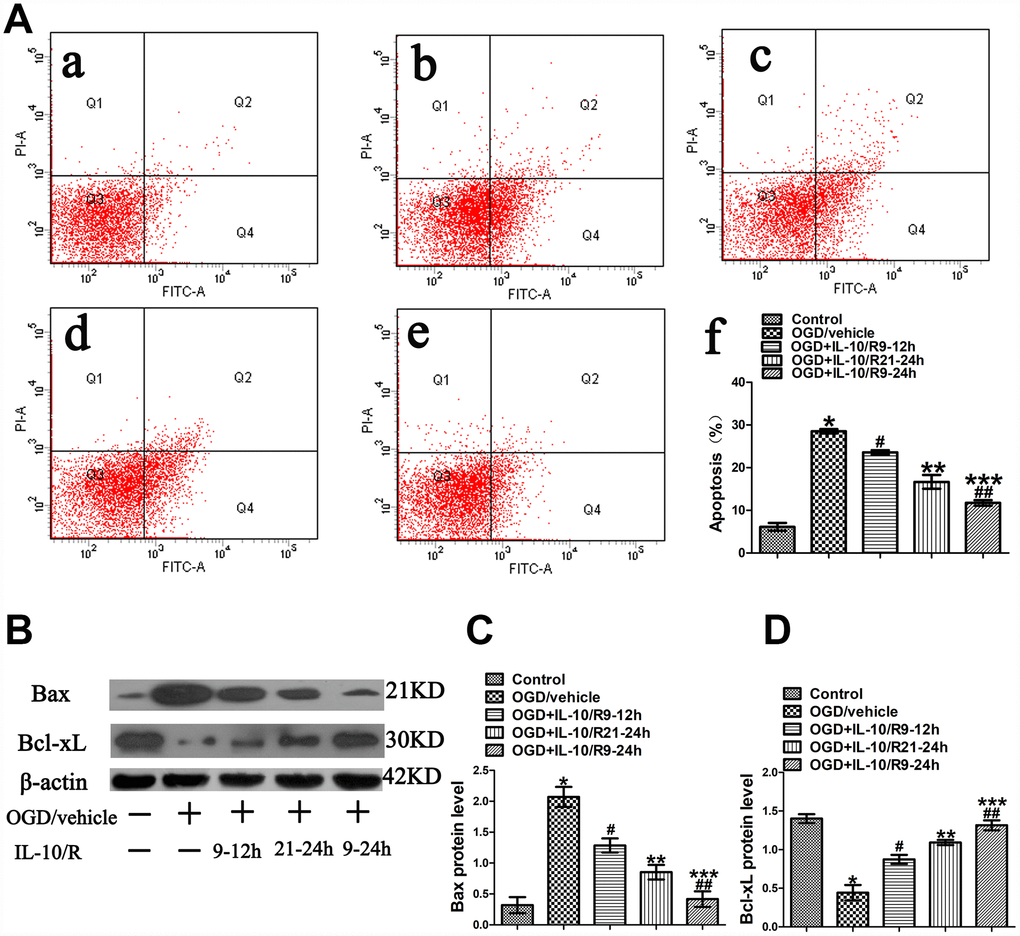
Figure 7.The strongest anti-apoptotic effect of IL-10 on cultured primary cortical neurons after OGD injury. (A) Forty-eight hours after OGD, apoptosis of neurons was detected by flow cytometry. The signals from apoptotic neurons were localized in the Q2 and Q4 quadrants of the resulting dot-plot graph. (a) Control group; (b) OGD group; (c) OGD+IL-10/R9-12h group; (d) OGD+IL-10/R21-24h; (e) OGD+IL-10/R9-24h; (f) Statistical graph of apoptosis in different groups (n=3). *p<0.001, as compared with Control group; #p<0.01, as compared with OGD group; **p<0.001, as compared with OGD group; ##p<0.001, as compared with OGD+IL-10/R9-12h group; ***p<0.01, as compared with OGD+IL-10/R21-24h group; by one way analysis of variance (ANOVA) followed by Student-Newman-Keuls multiple comparison test, F=92.017, p<0.0001. (B) The representative image of western blot analysis for Bax and Bcl-xL expression. (C) Western blot analysis of Bax (n=3). *p<0.001, as compared with Control group; #p<0.01, as compared with OGD group; **p<0.001, as compared with OGD group; ##p<0.01, as compared with OGD+IL-10/R9-12h group; ***p<0.05, as compared with OGD+IL-10/R21-24h group; by one way analysis of variance (ANOVA) followed by Student-Newman-Keuls multiple comparison test, F=29.782, p<0.0001. (D) Western blot analysis of Bcl-xL (n=3). *p<0.001, as compared with Control group; #p<0.001, as compared with OGD group; **p<0.001, as compared with OGD group; ##p<0.01, as compared with OGD+IL-10/R9-12h group; ***p<0.05, as compared with OGD+IL-10/R21-24h group; by one way analysis of variance (ANOVA) followed by Student-Newman-Keuls multiple comparison test, F=33.906, p<0.0001. All data are presented as mean±SEM.