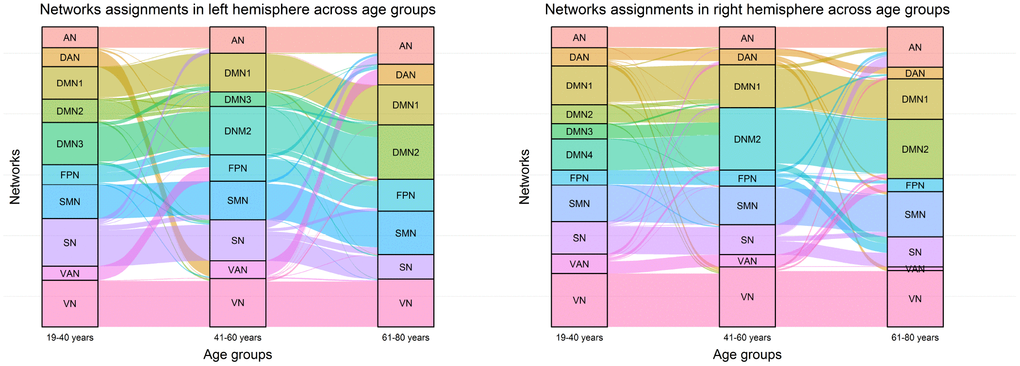
Figure 5.Network assignment across three age groups. The left alluvial diagram indicates community reorganization of the left brain regions with age; the right alluvial diagram indicates community reorganization of the right brain regions with age. Each block represents a network, and each line corresponds to a brain region.