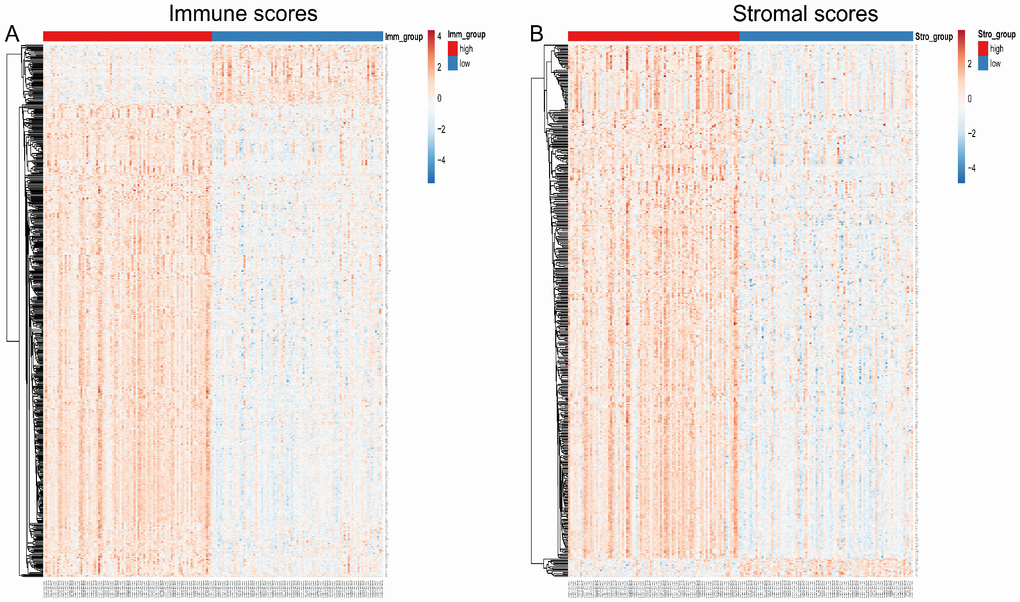
Figure 2.Heatmap of differentially expressed genes in the high and low immune/stromal score groups. (A) Immune scores (high score, left; low score, right. |log FC| > 1.5, q-value < 0.05). (B) Stromal scores (high score, left; low score, right. |log FC| > 1.5, q-value < 0.05).