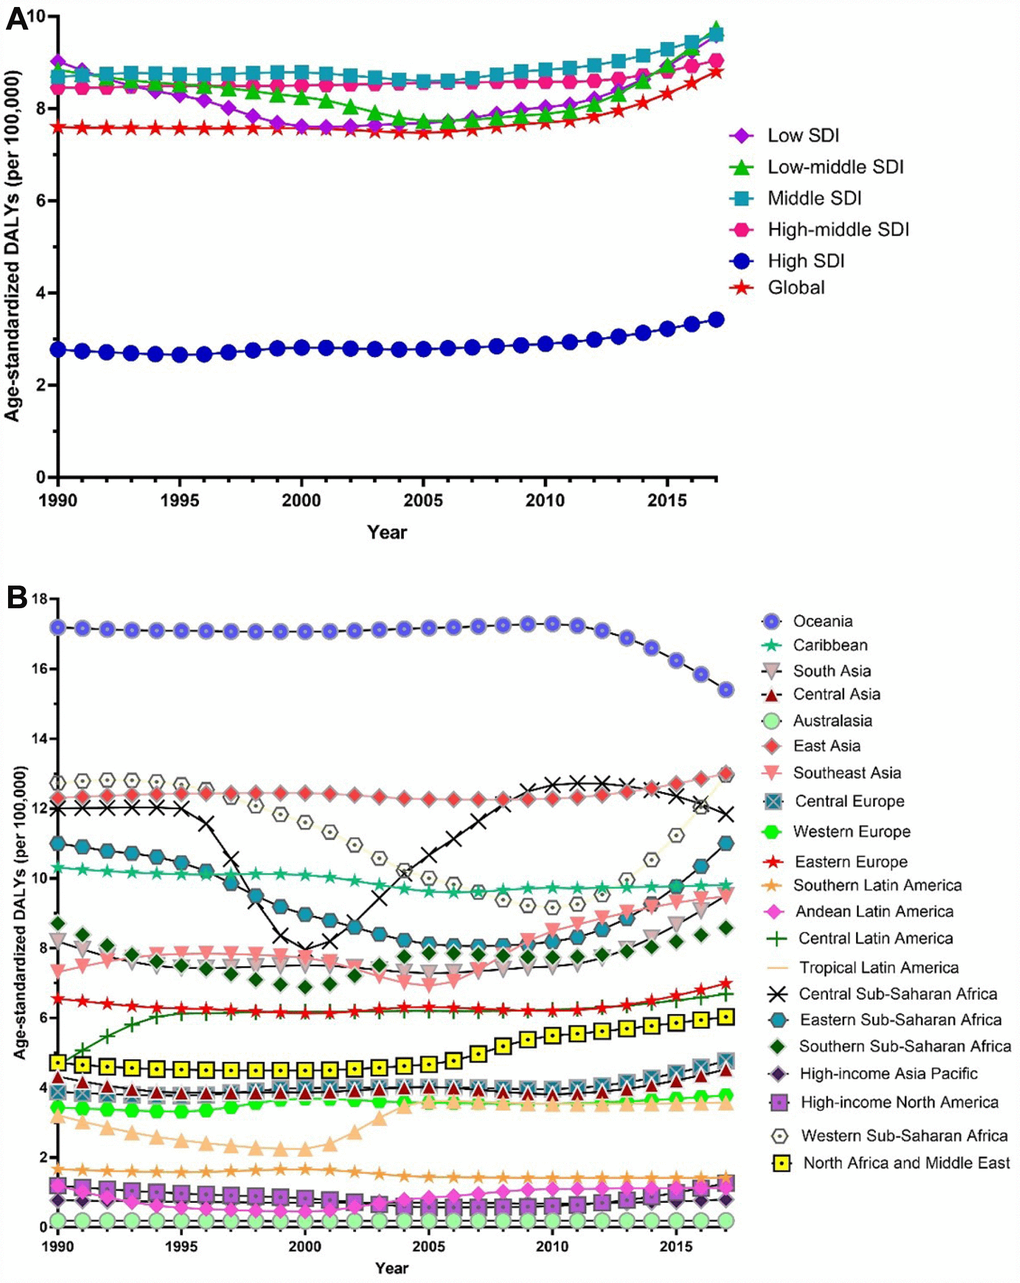
Figure 7.Trends in global disease burden of female infertility disability-adjusted life-years from 1990–2017. (A) Trends in global disease burden of female infertility disability-adjusted life-years by socio-demographic index from 1990–2017; (B) Trends in global disease burden of female infertility disability-adjusted life-years by region from 1990–2017).