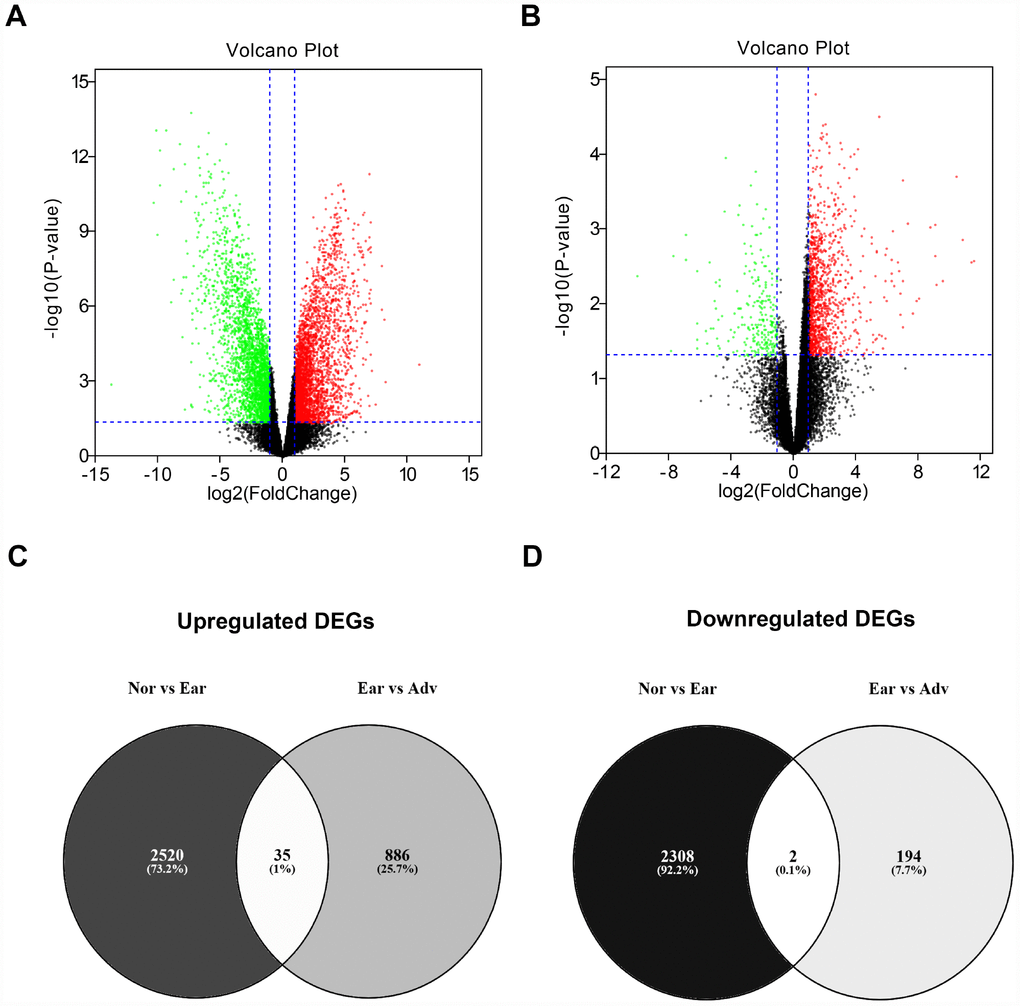
Figure 2.Identification of differentially expressed genes (DEGs) between ovarian cancer and normal controls. (A) Volcano plot showing the DEGs between normal samples (n=10) and early ovarian cancer (n=8). (B) Volcano plot showing the DEGs between early ovarian cancer (n=8) and advanced ovarian cancer (n=35). Note: the black dots represent genes that are not significantly differentially expressed between two groups, and the green dots and red dots represent the downregulated and upregulated genes in early ovarian cancer (compared with normal samples) and advanced ovarian cancer (compared with early ovarian cancer), respectively. |log2FC| > 1 and P-value < 0.05 were set as the cut-off criteria. FC = fold change. (C) The intersection of upregulated DEGs of “Nor vs Ear” and “Ear vs Adv”. (D) The intersection of downregulated DEGs of “Nor vs Ear” and “Ear vs Adv”. “Nor” vs Ear” represents the differential expression analysis between normal samples and early ovarian cancer. “Ear vs Adv” represents the differential expression analysis between early ovarian cancer and advanced ovarian cancer.