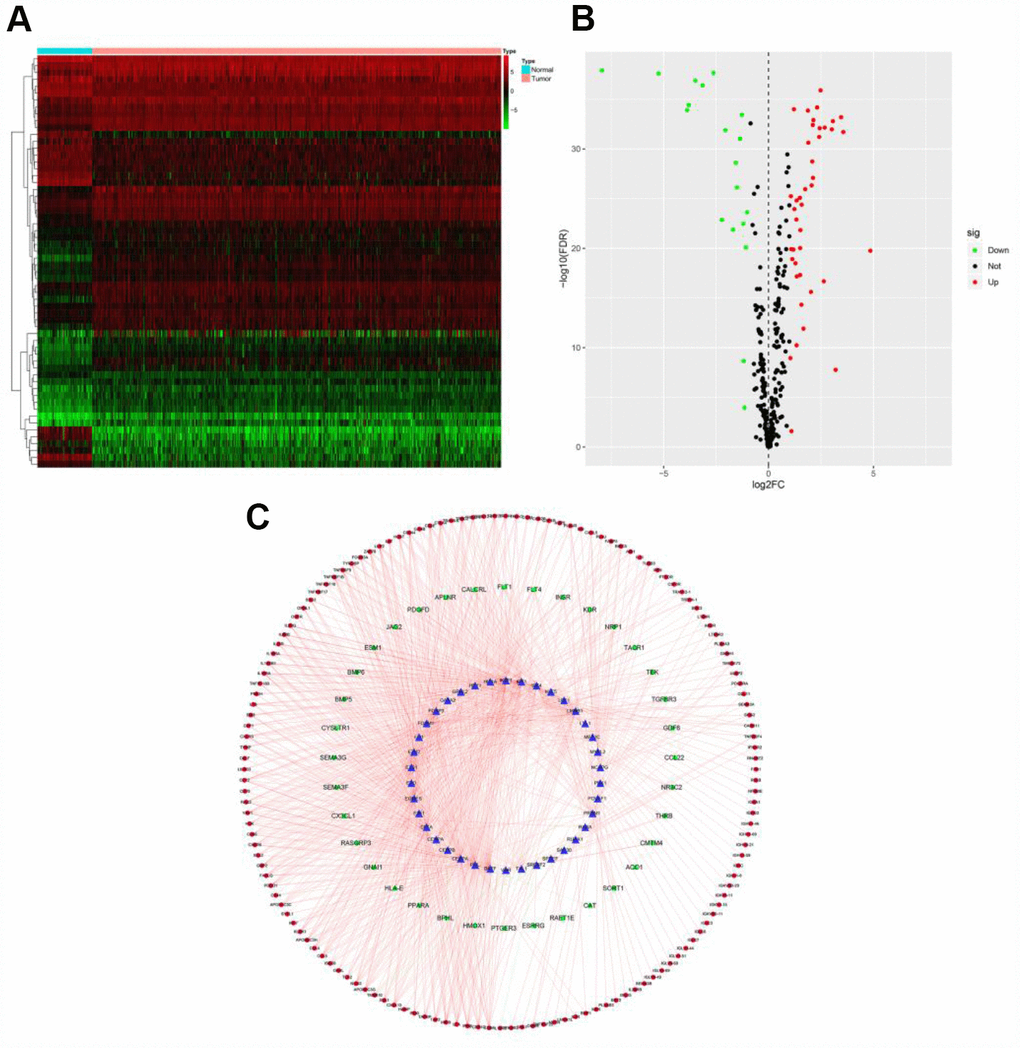
Figure 3.TF-based regulatory network. (A) Heat map of differentially expressed TFs; the green to red spectrum indicates low to high TF expression. (B) Volcano plot of TFs; the green dots represent downregulated TFs, the red dots represent upregulated TFs and the black dots represent TFs that were not significantly differentially expressed. (C) Regulatory network of TFs and PDEIRGs; the green nodes represent PDEIRGs with hazard ratios < 1 (p < 0.05), the red nodes represent PDEIRGs with hazard ratios > 1 (p < 0.05), the blue nodes represent TFs that correlated with the PDEIRGs in terms of their mRNA levels (correlation coefficient > 0.4 and p < 0.05), the green lines indicate negative regulatory relationships and the red lines indicate positive regulatory relationships.