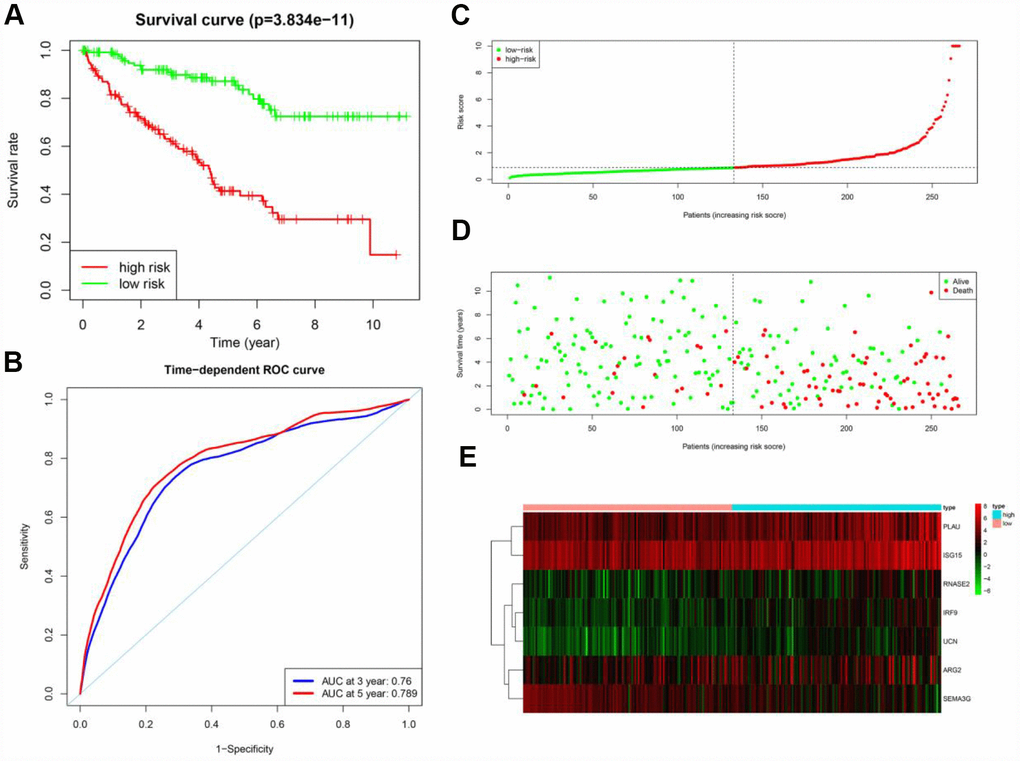
Figure 6.Prognostic analysis of the training cohort. (A) Kaplan-Meier curve analysis of the high-risk and low-risk groups. (B) Time-dependent ROC curve analysis of the prognostic model. (C) Risk score distribution of patients in the prognostic model. (D) Survival status scatter plots for patients in the prognostic model. (E) Expression patterns of risk genes in the prognostic model.