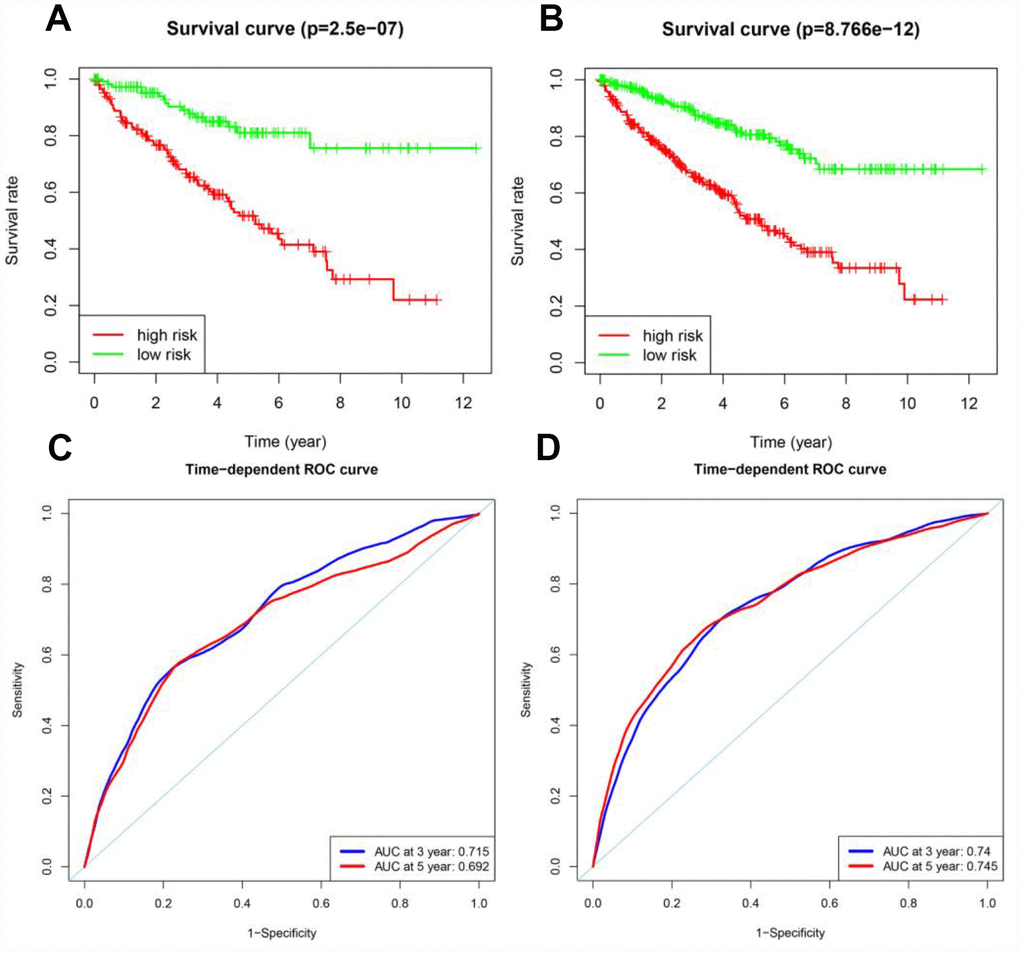
Figure 7.Prognostic analyses of the testing cohort and the entire TCGA cohort. (A) Kaplan-Meier curve analysis of high-risk and low-risk patients in the testing cohort. (B) Kaplan-Meier curve analysis of high-risk and low-risk patients in the entire TCGA cohort. (C) Time-dependent ROC curve analysis of the testing cohort. (D) Time-dependent ROC curve analysis of the entire TCGA cohort.