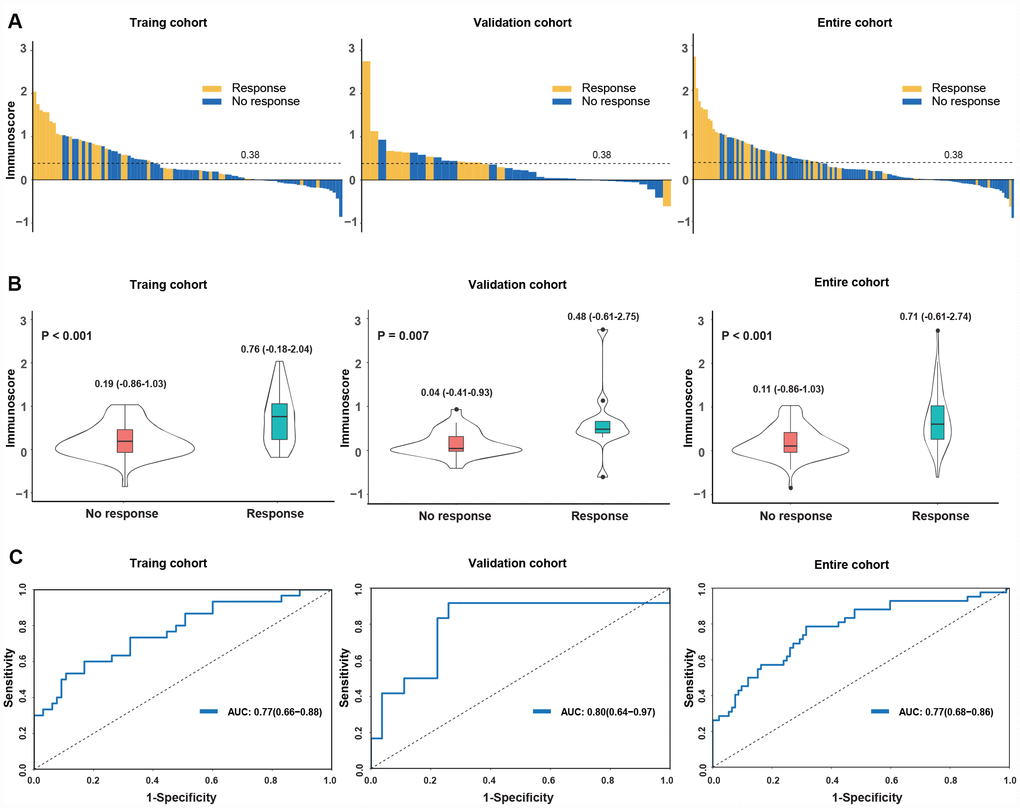
Figure 2.Distribution of the immunoscore and response status to anti-PD1 therapy in the training, validation and entire cohorts. (A) Waterfall plots for the distribution of the immunoscore and response status of individual patients. (B) Distribution of the immunoscore in responders and nonresponders. The box plots inside the violin indicate the median value and interquartile range of the immunoscore. We calculated the P-value with a one-way ANOVA test. (C) Receiver operating characteristic (ROC) curves of the immunoscore in three cohorts. The area under the ROC curve in the training, validation and entire cohorts was 0.77, 0.80 and 0.77, respectively.