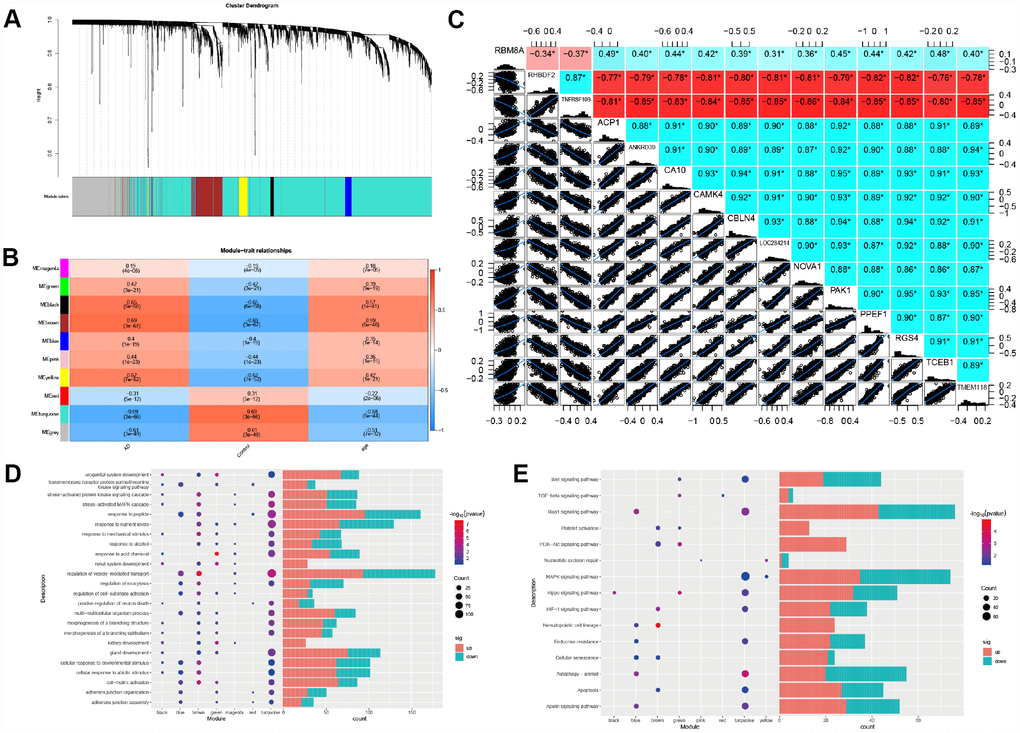
Figure 3.Weighted correlation network analysis. (A) Recognition module, each module was given an individual color as identifiers, including 10 different modules. (B) Correlation heat map of gene modules and phenotypes, the red is positively correlated with the phenotype, blue is negatively correlated with the phenotype. (C) The correlation between RBM8A and hub genes, red indicates negative correlation and blue indicates positive correlation (D) Biological processes of module genes, the significance of enrichment gradually increases from blue to red, and the size of the dots indicates the number of differential genes contained in the corresponding pathway. (E) KEGG pathways analysis of module genes. The significance of enrichment gradually increases from blue to red, and the size of the dots indicates the number of differential genes contained in the corresponding pathway.