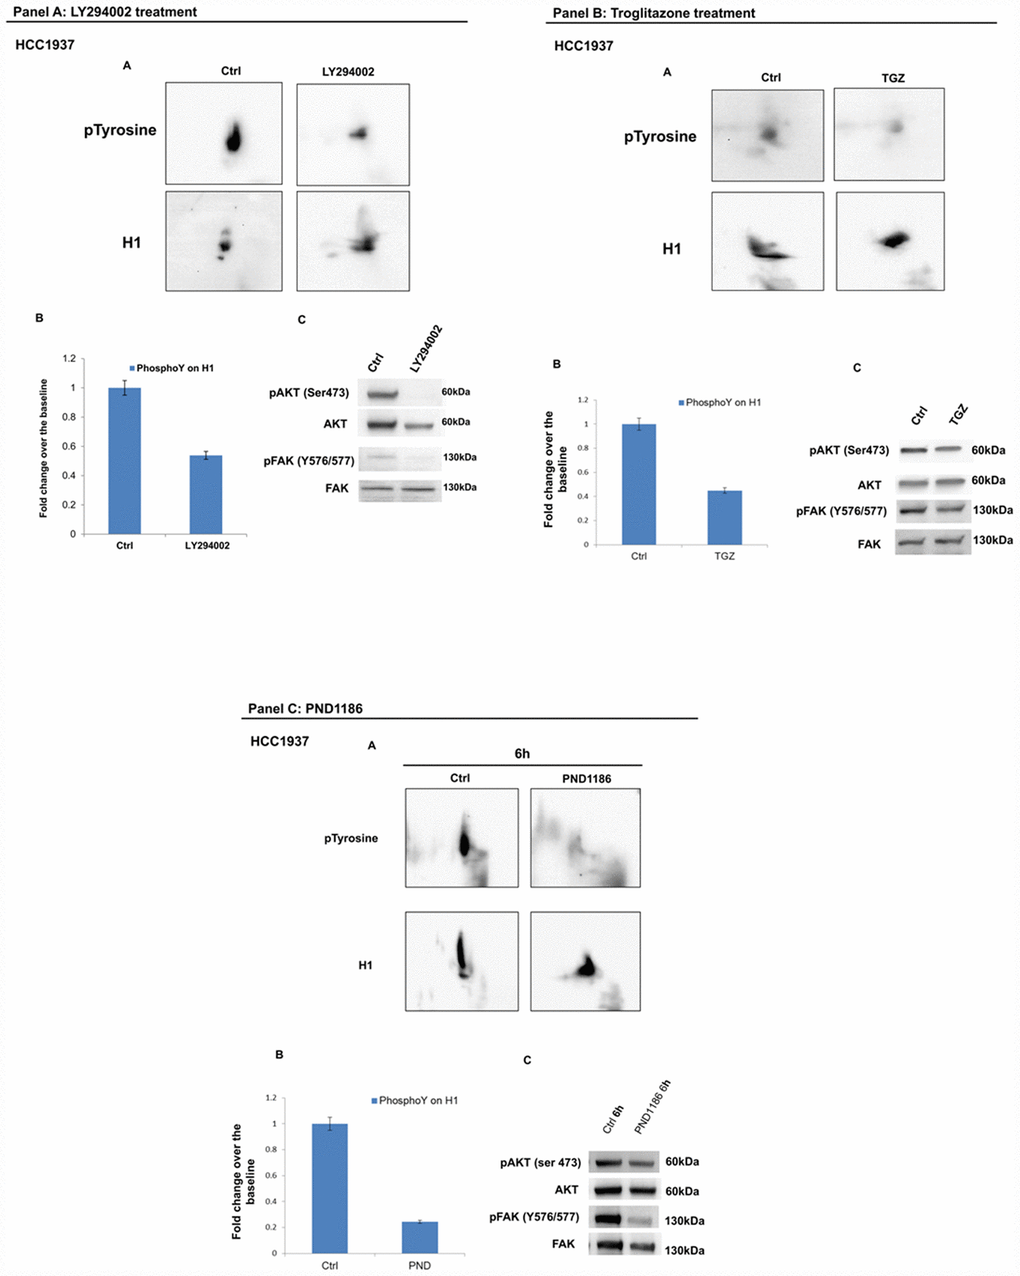
Figure 9.Analysis of H1 histone tyrosine phosphorylation following LY294002, Troglitazone and PND1186 treatments in HCC1937 cells. (Panel A) Analysis of H1 histone tyrosine phosphorylation following LY294002 treatments in HCC1937 cells. (A) 2D TAU Western blot analysis of histone H1 tyrosine phosphorylation level (upper panel) and relative normalization with H1 antibody (lower panel) after treatment of HCC1937 with LY294002; All WB 2D images were acquired in 4 seconds. (B) Densitometry analysis of H1 tyrosine phosphorylation spots; (C) Western blot analysis of pAKT, and pFAK (Y576/577) levels in protein extracts from LY294002 treated cells. Phospho-Akt (ser473) and pFAK (Y576/577) signals were normalized to the corresponding total Akt and total FAK respectively. (Panel B) Analysis of H1 histone tyrosine phosphorylation following Troglitazone treatments in HCC1937 cells. (A) 2D TAU Western blot analysis of histone H1 tyrosine phosphorylation level (upper panel) and relative normalization with H1 antibody (lower panel) after treatment of HCC1937 with Troglitazone; All WB 2D images were acquired in 4 seconds. (B) Densitometry analysis of H1 tyrosine phosphorylation spots; (C) Western blot analysis of pAKT, and pFAK (Y576/577) levels in protein extract from Troglitazone treated cells. Phospho-Akt (S473) and p-FAK (Y576/577) signals were normalized to the corresponding total Akt and total FAK respectively. (Panel C) Analysis of H1 histone tyrosine phosphorylation following PND1186 treatments in HCC1937 cells. (A) 2D TAU Western blot map of histone H1 tyrosine phosphorylation (upper panel) and relative normalization with H1 antibody (lower panel) after PND1186 treatment; All WB 2D images were acquired in 4 seconds. (B) Densitometry analysis of H1 tyrosine phosphorylation spots; (C) Western blot analysis of pAKT, and p-FAK levels in protein extract from PND1186 treated cells. Phospho-Akt (S473) and pFAK (Y576/577) signals were normalized to the corresponding total Akt and total FAK respectively. The assays were repeated in three independent biological replicates. Data are expressed as mean ± SEM (N =3).