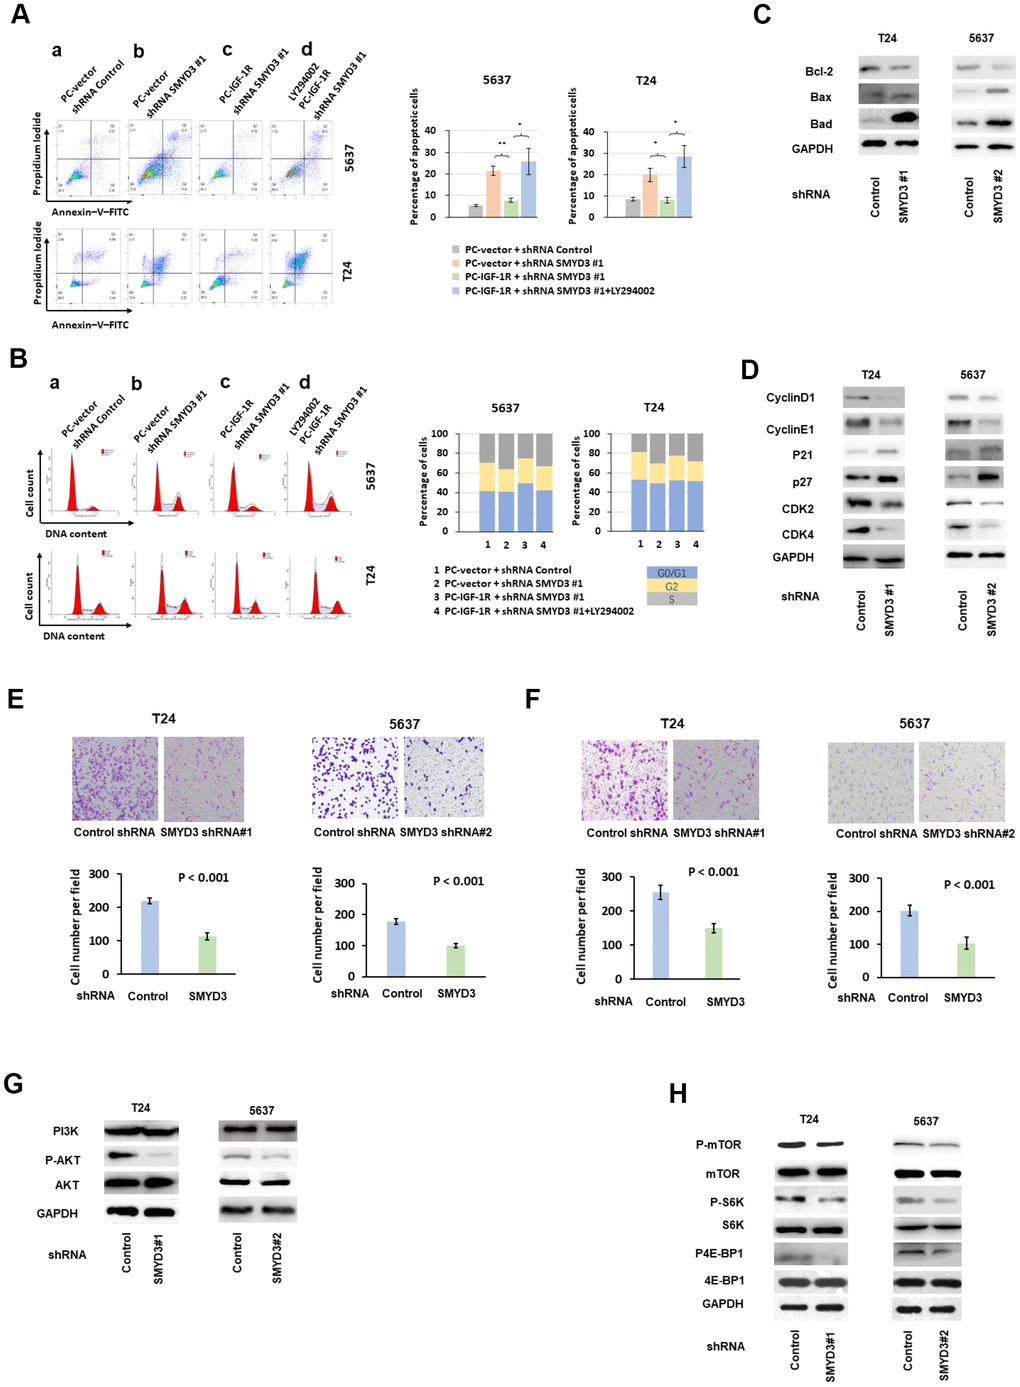
Figure 3.SMYD3 promotes tumorigenic phenotypes and activates AKT/mTOR signaling pathway in BC cells. (A) Left: representative images of PI/Annexin V staining of T24 and 5637 cells transfected with indicated vectors or treated with PI3K/AKT inhibitor LY294002(20μmol/L). Four independent experiments were performed for each cell line. Right: quantification of cells in apoptosis. Bar: SD, **: P< 0.01, *: P< 0.05, t test. (B) Representative examples of propidium iodide staining of T24 and 5637 cells as indicated above. Four independent experiments were performed for each cell line. The percentage of cells in each transfected population in each cycle phase was calculated (right panels). (C) Western blot analysis of Bcl-2, Bax and Bad protein expression in T24 and 5637 cells transfected with SMYD3-shRNA or con-shRNA. (D) Western blot analysis of cyclin D1, cyclin E1, p21, p27 CDK2 and CDK4 protein expression in T24 and 5637 cells transfected with SMYD3-shRNA or control shRNA. GAPDH served as a loading control. (E) Transwell migration assays of T24 and 5637 cell lines. Upper: representative images of Transwell migration assays of BC cells 48 h after incubation. Lower: The cells that migrated to the lower compartment were counted in by light microscopy at X 40 magnification. Tweleve representative fields were analyzed for each well after 48 h of incubation (n=4). Bar: SD, t test. (F) Upper: Representative images of Transwell invasion assays of BC cells 48 h after incubation. Lower: Transwell invasion assays of T24 and 5637 cell lines. The cells were counted in 12 representative fields for each well after 48 h of incubation (n=4). Bar: SD, t test. (G) Western blot analysis of PI3K, phosphorylated-AKT (P-AKT) and AKT protein expression in T24 and 5637 cells transfected with SMYD3 shRNA or control shRNA. Three independent experiments were performed. (H) Western blot analysis of p-mTOR, mTOR, p70, S6K, p4E-BP1 and 4E-BP1 protein expression in T24 and 5637 cells transfected with SMYD3 shRNA or control shRNA. GAPDH served as a loading control. p-S6K, phosphorylated S6K; p4E-BP1, phosphorylated 4E-BP1. Three independent experiments were performed.