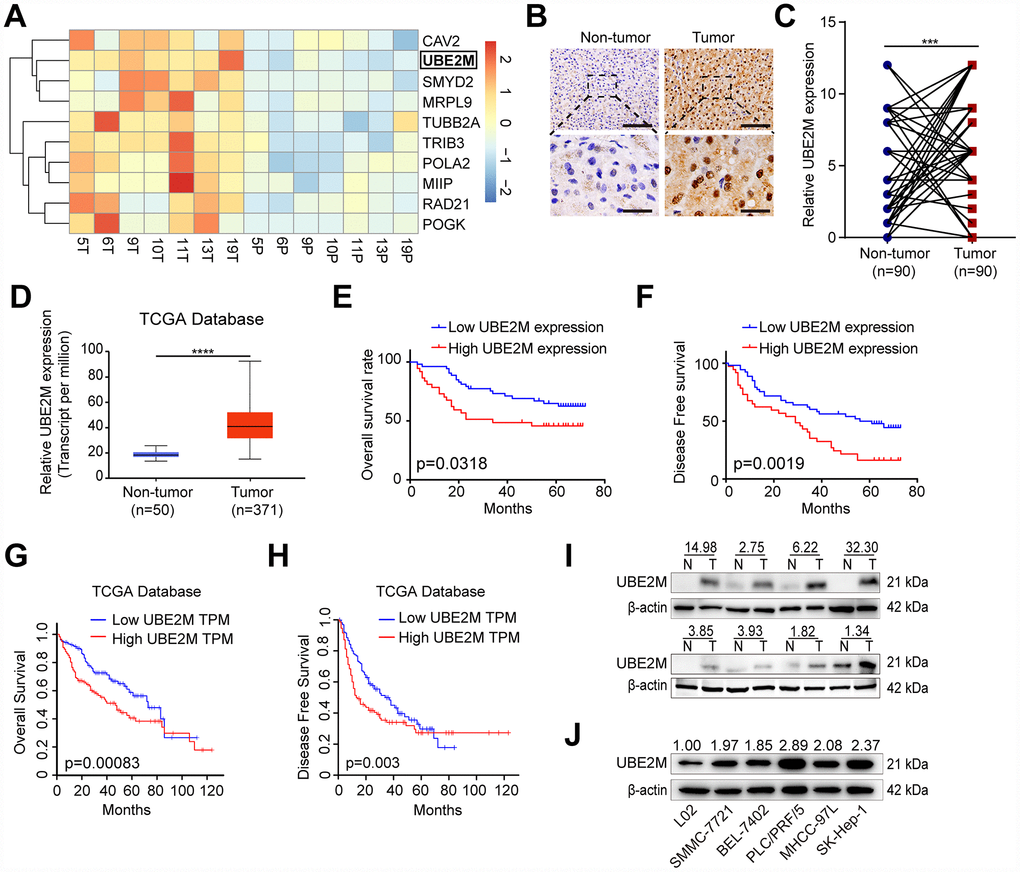
Figure 1.Overexpressed UBE2M in HCC tissues and cell lines. (A) Heatmap showing differential expression of genes in 7 paired HCC tissues using a mRNA microarray. (B) Representative images showing UBE2M expression in HCC and paired non-tumor tissues (Scale bar, 400 μm in the upper panel, and 100 μm in the lower panel). (C) UBE2M expression in HCC and paired non-tumor tissues using a pair-wise comparison analysis (***P < 0.001). (D) UBE2M expression in 371 HCC and 50 non-tumor tissues obtained from The Cancer Genome Atlas (TCGA) database (****P < 0.0001, Student’s t-test). Adapted from UALCAN: http://ualcan.path.uab.edu/index.html. (E) A Kaplan-Meier plot showing the overall survival rate of HCC patients with low- and high-UBE2M expression in our HCC cohort (P = 0.0318, log-rank test). (F) A Kaplan-Meier plot showing the disease-free survival of HCC patients with low- and high-UBE2M expression in our HCC cohort (P = 0.0019, log-rank test). (G) A Kaplan-Meier plot showing the overall survival rate of HCC patients with low- and high-UBE2M expression in TCGA database (P = 0.00083, log-rank test; TPM, transcript per million). Adapted from GEPIA: http://gepia.cancer-pku.cn/index.html. (H) A Kaplan-Meier plot showing the disease-free survival of HCC patients with low- and high-UBE2M expression in TCGA database (P = 0.003, log-rank test). Adapted from GEPIA: http://gepia.cancer-pku.cn/index.html. (I) UBE2M protein expression in 8 pairs of HCC tissues by Western blotting (N, non-tumor; T, tumor). (J) UBE2M protein expression in five HCC cell lines and normal hepatocytes L02 by Western blotting.
Figure 1 — UBE2M promotes cell proliferation via the β-catenin/cyclin D1 signaling in hepatocellular carcinoma | Aging