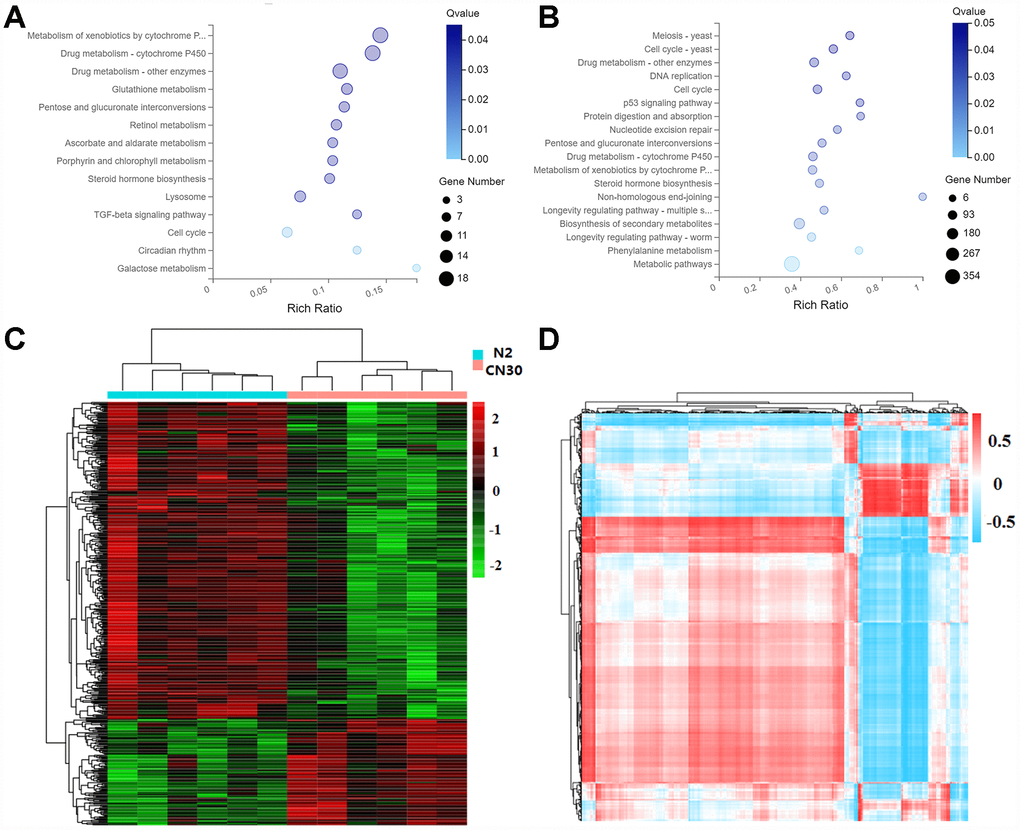
Figure 6.Variation in COX1 affects metabolic activity. (A) The significantly influenced KEGG pathways by mitochondria variation. X-axis: enrichment radio. Larger value represents greater degree of enrichment. Rich ratio indicates the number of differentially expressed genes located under the path term divided by the number of all annotated genes under the path term. Y-axis: pathway. Color: P-value. Circle size: number of genes. (B) Significantly influenced KEGG pathway by age. (C) Heat map of differentially expressed metabolites. The data were depicted as matrices in which each row represents one metabolite and each column represents one of the worm samples. Relative metabolite expression is depicted according to the color scale shown at the right side. Red and green colors represent high and low relative expression, respectively. The magnitude of deviation from the median is represented by color saturation. (D) Interactions between genes and metabolites both affected by the mitochondria variation. Pearson correlation coefficients that represents the association between genes and metabolites were depicted according to the color scale shown at the right side. Red and blue colors represent positive and negative correlations. The magnitude of deviation from the median is represented by color saturation.