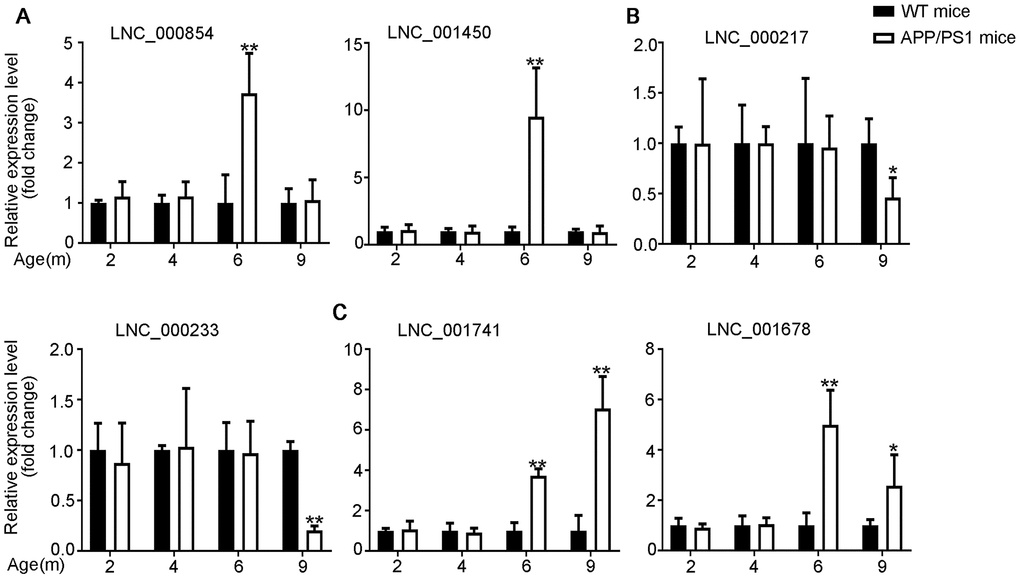
Figure 3.Validation of expression of lncRNAs by using qPCR. The identified differentially expressed transcripts (lncRNAs, miRNAs, and mRNAs) were divided into three groups. (A) 6yes9no group represents transcripts differential expressed at 6 months but not at 9 months; (B) 6no9yes group represents transcripts not differential expressed at 6 months but differential expressed at 9 months; (C) 6yes9yes group represents transcripts differential expressed at both 6 and 9 months. The expression of lncRNAs was quantified relative to Gapdh expression level by using the comparative cycle threshold (ΔCT) method. Data are presented as means ± SD (n = 3, *p < 0.05, **p < 0.01).