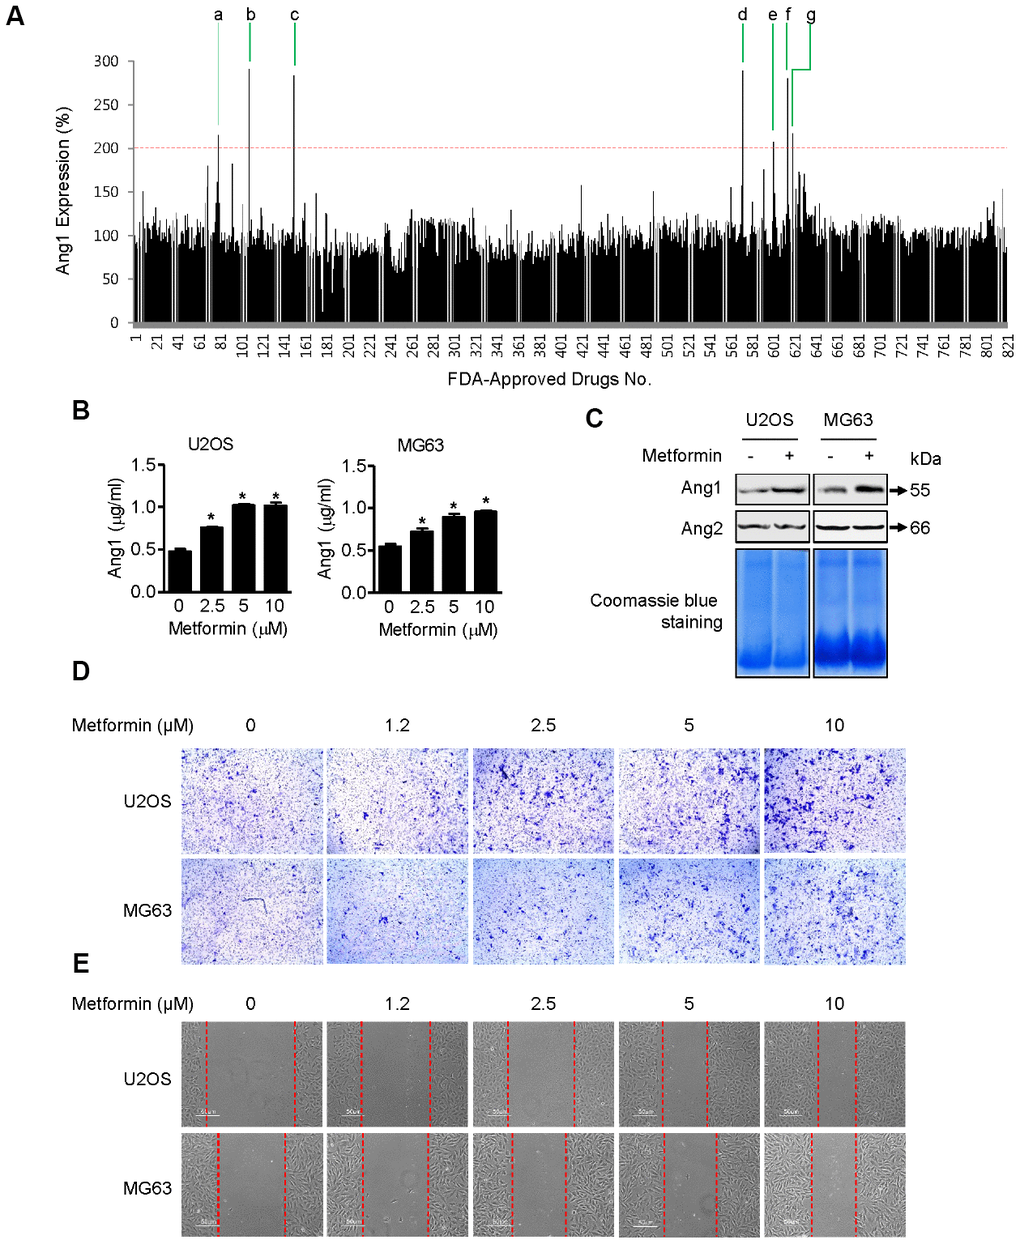
Figure 1.Induction of Ang1 expression and activation of cell mobility by metformin. (A) Screening result of FDA-approved drugs for Ang1 expression by ELISA. U2OS cells were seeded on 96-well plates. After treating cells with drugs for 1 h, each cell culture medium was transferred to a 96-well plate from the ELISA assay kit. Compounds that induced Ang1 expression over two-fold compared with DMSO vehicle control were selected and are listed in Table 1. (B) U2OS and MG63 cells were treated with 2.5, 5, and 10 μM of metformin or an equal volume of DMSO (0.1%) for 1 h. Cell culture medium was collected for Ang1 ELISA. Significant differences between metformin and DMSO control groups are indicated (*P < 0.05, a paired t-test). Experiments were performed in triplicate, and error bars represent standard deviation. (C) Cells were treated with 5 μM of metformin or an equal volume of DMSO (0.1%) for 1 h. Cell culture medium from the treated cells was condensed with a Microcon for Western blotting. Coomassie blue staining of SDS-PAGE gels was used for a loading control. Ang1: Angiopoetin1, Ang2: Angipoietin2. (D, E) (D) U2OS and MG63 cells were treated with 2.5, 5, and 10 μM of metformin or an equal volume of DMSO (0.1%) for 6 h. The membrane-traversed cells were fixed and stained with crystal violet solution. (E) Cell migration was observed and captured by microscopy at the indicated time point.