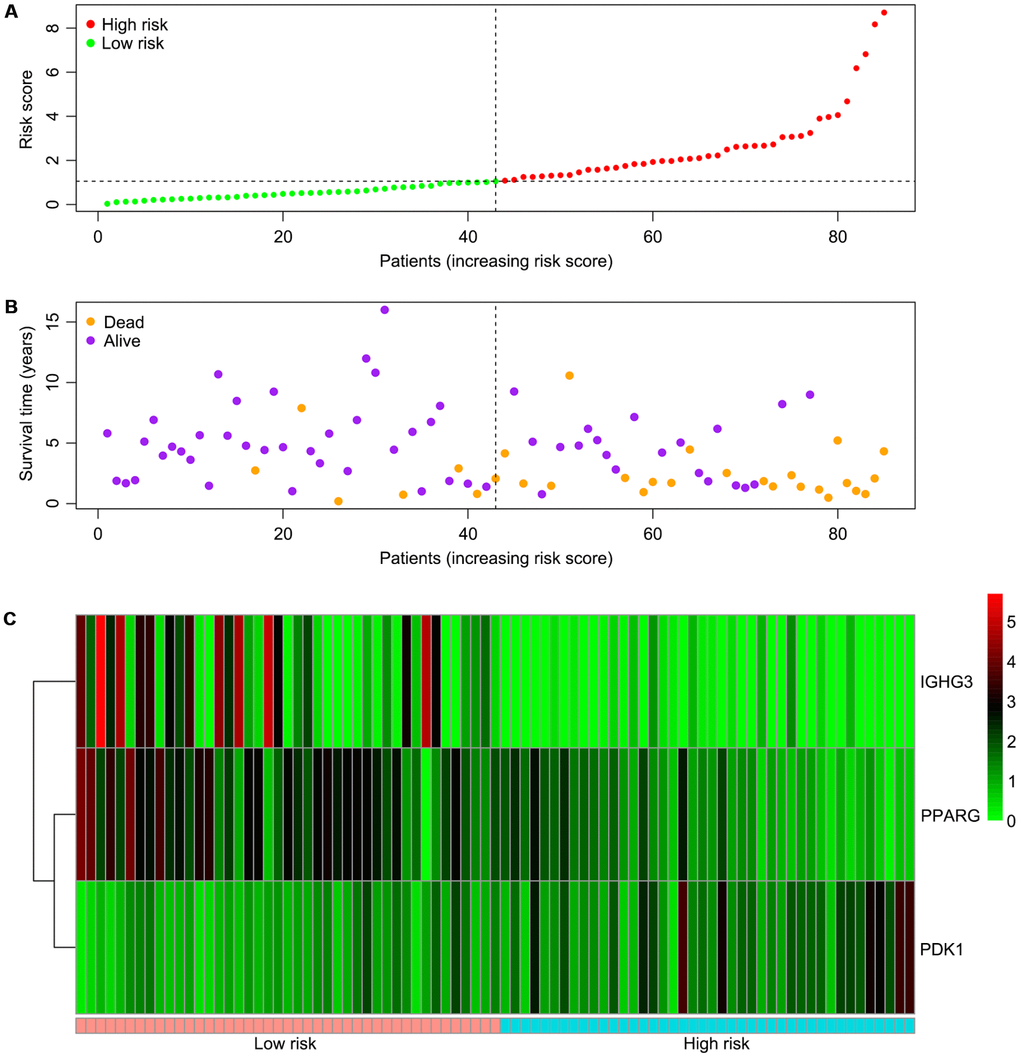
Figure 5.Associations of the risk score with the expression levels of three immune-related genes included in the risk model. (A) Dot plot of risk score. Vertical and horizontal axes respectively represent risk score and OS samples, ranked by increasing risk score. Red and green colors represent high and low risk cases, respectively. (B) Dot plot of survival. Vertical and horizontal axes respectively represent survival times and OS samples, ranked by increasing risk score. Orange and purple colors represent dead and living OS cases, respectively. (C) Heat map of the expression levels of the three genes. Vertical and horizontal axes respectively represent genes and OS samples, ranked by increasing risk score. Genes with higher, lower, and same expression levels are shown in red, green, and black, respectively. Color bars at the bottom of the heat map represent sample types, with pink and blue indicating low and high risk score samples, respectively. OS, osteosarcoma.