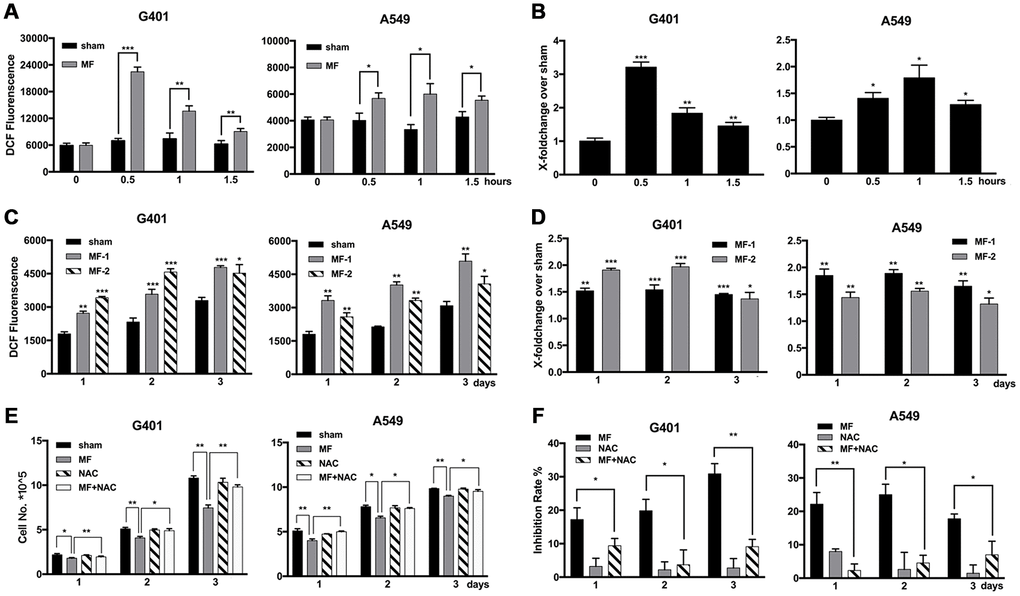
Figure 3.Elevated levels of ROS induced by MF exposure and use of ROS scavenger to decrease the antitumor effect. (A, B) G401 and A549 cells were subjected to MF exposure protocol in Supplementary Table 1, or sham exposure, 2 h daily for 3 consecutive days. ROS levels were measured daily after termination of exposure, shown either in the absolute value of fluorescence emission (A), or in fold of change from the MF group over the control group (B). (C, D) In G401 and A549 cells, during the 3-day exposure procedure, ROS levels were measured either right after exposure terminated (group MF-1), or on the next day after termination of exposure for 24 h (group MF-2). ROS levels were indicated either in the absolute value of fluorescence emission (C), or in fold of change (D). (E, F) G401 and A549 cells were subjected to the same exposure protocol, with or without incubation with NAC (1 mM). Cell growth curves (E) and the calculated inhibition rates (F) are presented. Data are expressed as mean ± SD (n=5). *: P<0.05; **: P<0.01; ***: P<0.001.
Figure 3 — Induction of apoptosis and ferroptosis by a tumor suppressing magnetic field through ROS-mediated DNA damage | Aging