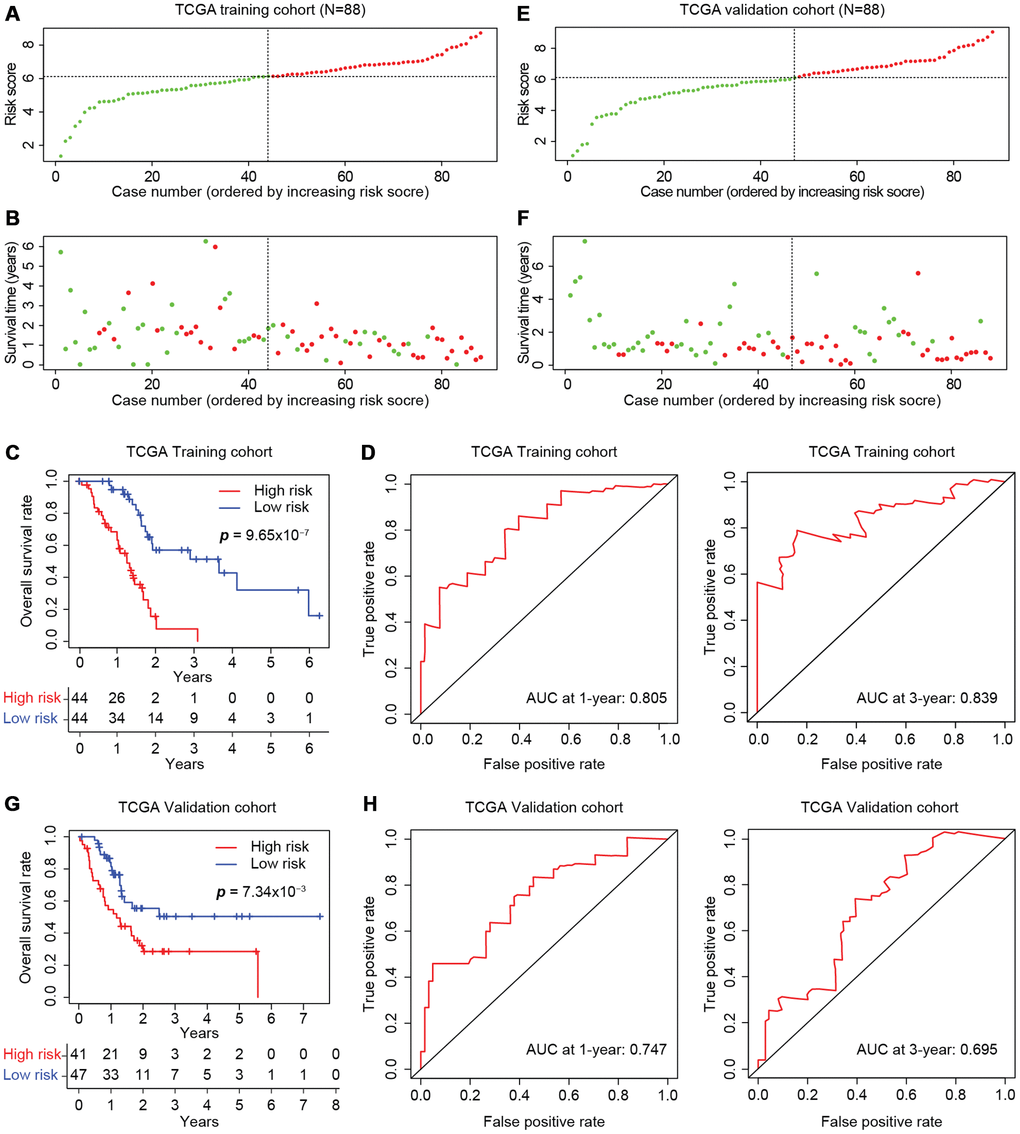
Figure 6.Development of the prognostic scoring model in TCGA cohorts. The distribution of risk scores is shown for the training (A) and validation (E) cohorts from TCGA. The dotted horizonal line indicates the cut-off level of the risk score used to stratify patients, and the dotted vertical line separates patients on the basis of low-risk (green) or high-risk (red). (B, F) The distribution of overall outcomes in the training (B) and validation (F) cohorts from TCGA. Surviving patients are shown in green, while deaths are shown in red. (C, G) Kaplan-Meier survival plots of patients predicted to be at risk for poor outcomes in the training (C) and validation (G) cohorts from TCGA. The number of patients remaining at a particular timepoint is shown at the bottom. (D, H) Time-dependent ROC curves for predicting one-year and three-year survival in the training (D) and validation (H) cohorts from TCGA.