Submit an Article
Navigate
Home
Editorial Board
Editorial Policies
Current Volume
Archive
Scientific Integrity
Publication Ethics Statements
Interviews with Outstanding Authors
Newsroom
Sponsored Conferences
Podcast
Contact
Special Collections
Submit an Article
Online ISSN: 1945-4589
Research Paper
|
Volume 12, Issue 5
|
pp. 4445–4462
Distribution patterns of microsatellites and development of its marker in different genomic regions of forest musk deer genome based on high throughput sequencing
Back to article
Figure 1
(1 of 5)
−
100%
+
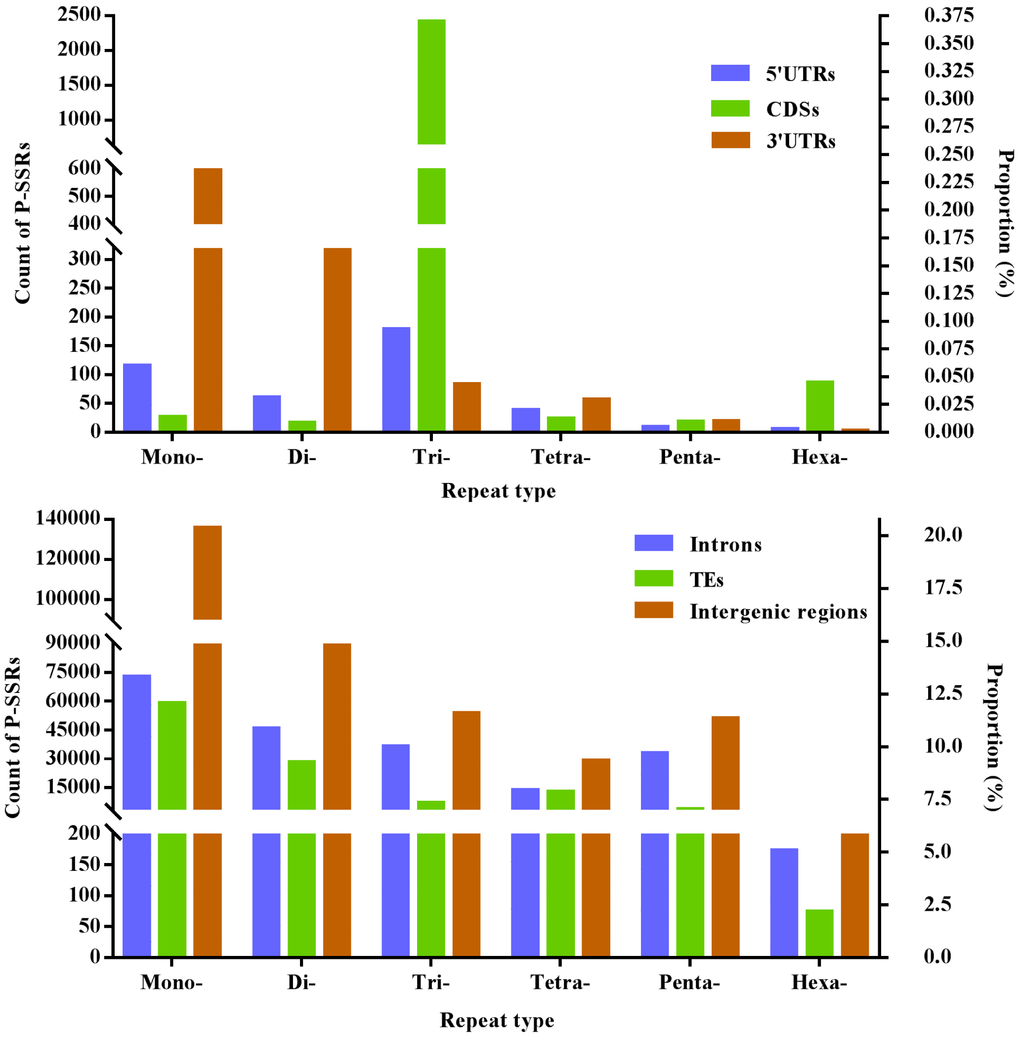
Figure 1.
The proportion of mono- to hexanucleotide P-SSRs in different genomic regions of FMD genome.