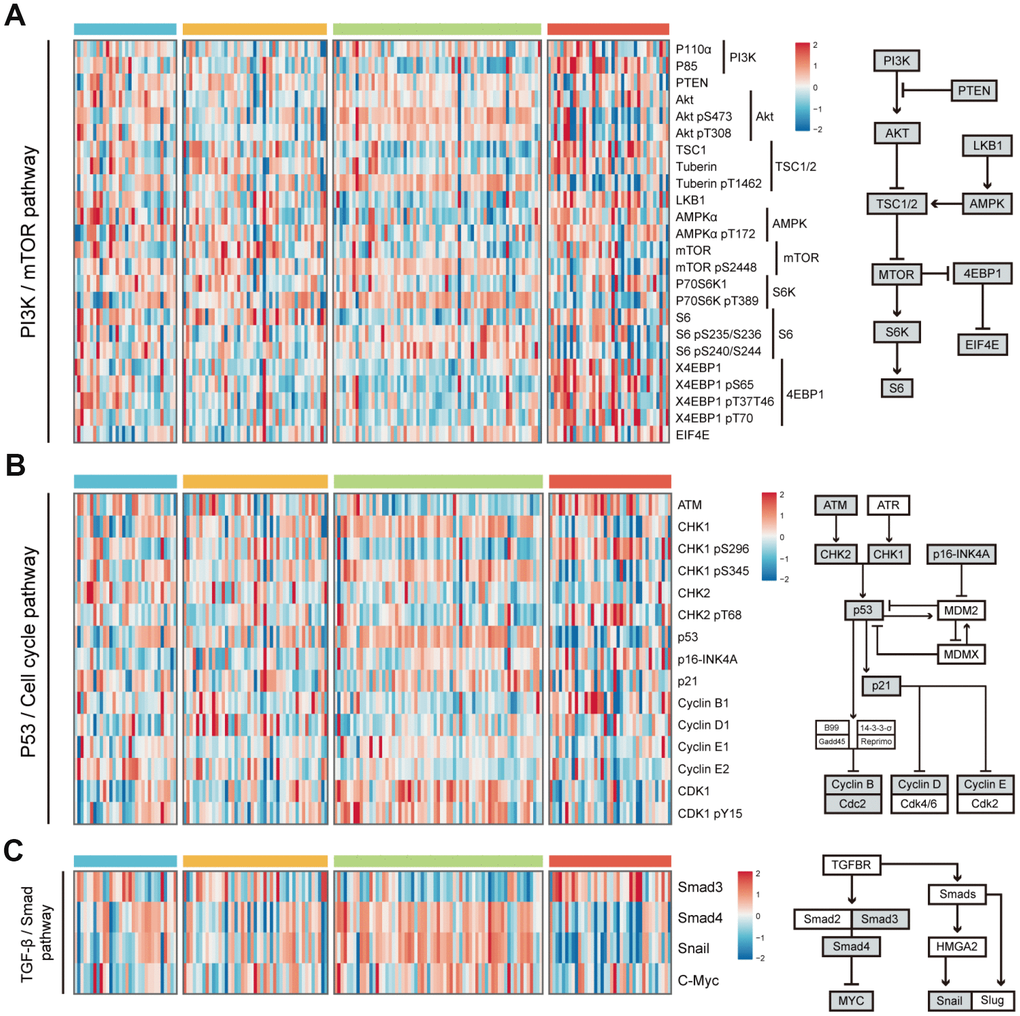
Figure 5.Difference of protein expression levels in PI3K/mTOR pathway, P53/Cell cycle pathway, and TGF-β/Smad pathway among 4 HCC subclasses. (A) Heatmap shows the expression level of 24 proteins in PI3K/mTOR pathway. The right half of the figure shows the basic components of PI3K/mTOR pathway. (B) Heatmap shows the expression level of 15 proteins in P53/Cell cycle pathway. The right half of the figure shows the basic components of P53/Cell cycle pathway. (C) Heatmap shows the expression level of proteins in TGF-β/Smad pathway. The right half of the figure shows the basic components of TGF-β/Smad pathway (see detailed information in Supplementary Figure 3). Data is available for proteins inside grey boxes. HCC: hepatocellular carcinoma.