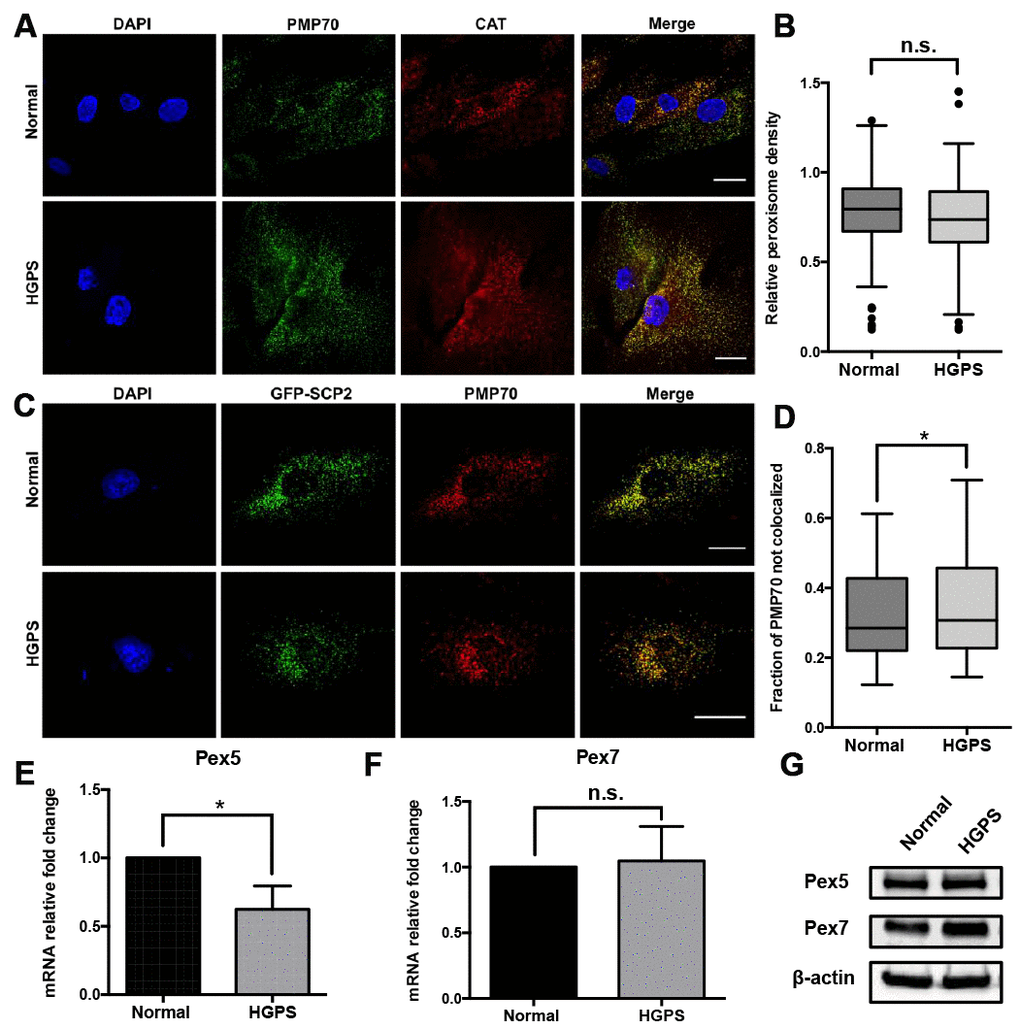
Figure 1.Characterization of the peroxisomes in HGPS fibroblasts. (A) Peroxisomes localization indicated by PMP70 and catalase immunofluorescence staining in HGPS patient-derived dermal fibroblasts and its normal counterpart. Bar = 25μm. (B) The peroxisomes density per cell was indicated by the quantification of PMP70 puncta per square unit in normal and HGPS fibroblast cells. More than 100 cells from 3 independent experiments were analyzed and the data was represented in Tukey box plot. Boxes show the 25th, 50th, and 75th percentiles and the dots indicate the outliers. (C) Confocal fluorescence microscopy analysis of normal and HGPS fibroblasts transfected with GFP-SCP2, and probed with PMP70 antibody. Bar = 25μm. (D) Box plot of the portion of PMP70 puncta not colocalized with SCP2 (peroxisomal ghosts) in each cell. More than 100 cells from 3 independent experiments were analyzed. Boxes show the 25th, 50th, and 75th percentiles. Kolmogorov-Smirnov test was used to compare the distributions of these two samples. (E, F) Quantitative RT-PCR analysis of the relative expression of Pex5 and Pex7 in normal and HGPS fibroblasts. (G) Western blot analysis of Pex5 and Pex7 in normal and HGPS fibroblasts at passage 21. All experiments were performed using mid-passage cells between p15 to p25. All experiments were repeated at least three times and representative data were shown as indicated. *, p < 0.05, n.s., not significant.