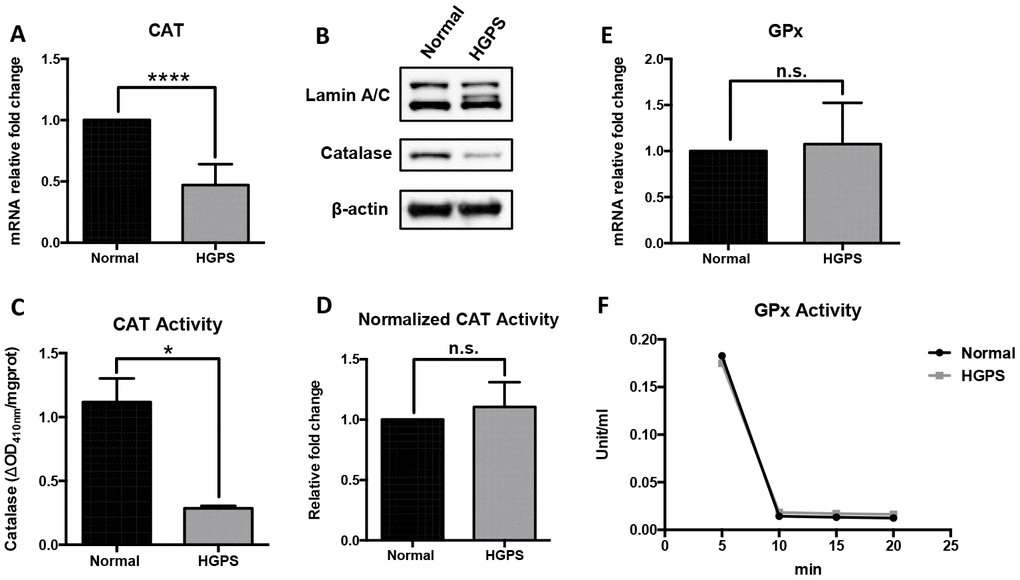
Figure 2.Characterization of the ROS-scavenging enzymes in HGPS peroxisomes. (A) Quantitative RT-PCR analysis of the relative expression of catalase in normal and HGPS fibroblasts. ****, p < 0.0001. (B) Western blot analysis of Lamin A/C, progerin and catalase expression in normal and HGPS fibroblasts at passage 25. (C) Catalase activity assay measured by the decomposed H2O2 per mg total protein from normal and HGPS fibroblasts. *, p < 0.05. (D) Catalase activity normalized with the protein expression level in normal and HGPS fibroblasts. n.s., not significant. (E) Quantitative RT-PCR analysis of the relative expression of Glutathione peroxidase in normal and HGPS fibroblasts. n.s., not significant. (F) Glutathione peroxidase activity in normal and HGPS fibroblasts. All experiments were performed using mid-passage cells between p15 to p25. All experiments were repeated at least three times and representative data were shown as indicated.