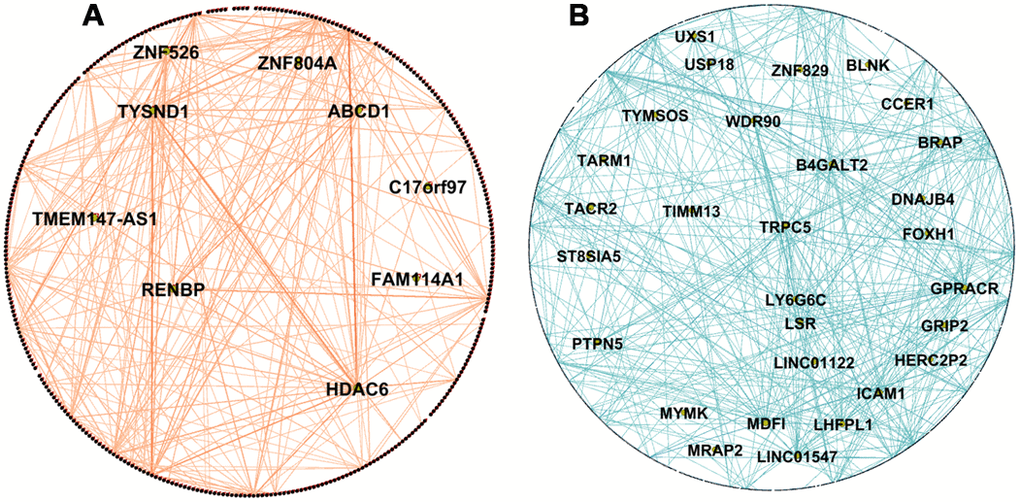
Figure 3.Network visualization of PD and AD modules. (A) Visualization of WGCNA network connections of the PDPD salmon network module found to be associated with insulin resistance and not preserved in the PDHC network. It shows network connections whose adjacency is above 0.2, including all 351 nodes and 595 of 61776 edges. (B) Visualization of WGCNA network connections of the ADAD blue module found to be associated with regulation of lipolysis in adipocytes and neuroactive ligand-receptor interaction and not preserved in ADHC and ADMCI networks. It shows network connections whose adjacency is above 0.55, including all 1076 nodes and 1458 of 1157776 edges. Hub genes are in the center of the network and are labelled with names. Networks visualized in Gephi [23].