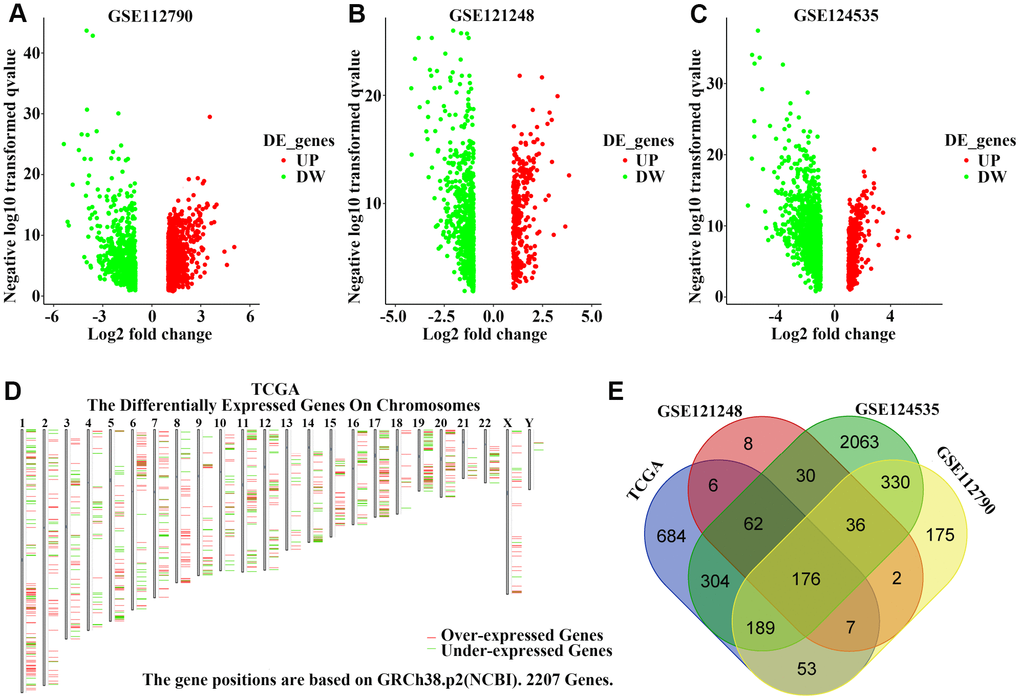
Figure 1.Identification of upregulated genes in hepatocellular carcinoma (HCC) tissues. (A–C) Volcano plot visualizing the differentially-expressed genes between HCC and non-tumor tissues in (A) GSE112790, (B) GSE121248, and (C) GSE124535 datasets. Each symbol represents a gene, and red or green colors indicate upregulated or downregulated genes, respectively. (D) The specific chromosomal locations of differentially-expressed genes between HCC and non-tumor tissues in the TCGA cohort. Red indicates overexpressed genes and green indicates downregulated genes. The vertical line represents chromosomes. (E) Common upregulated genes among GSE112790, GSE121248, GSE124535, and TCGA datasets.