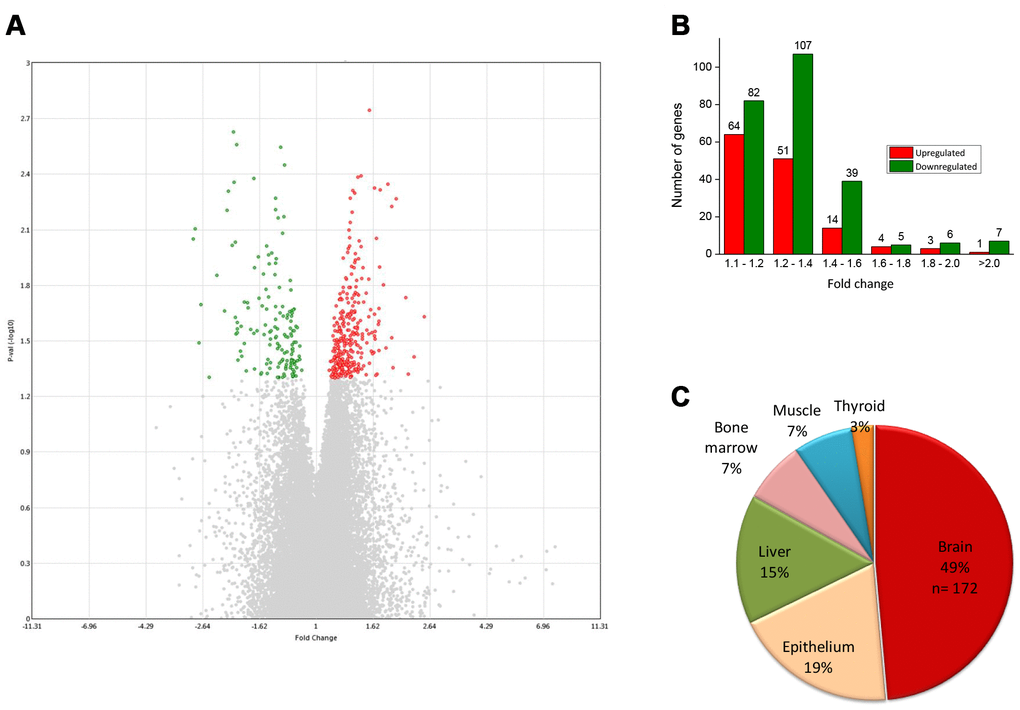
Figure 1.(A) Volcano plot displaying DEGs between verbenalin-treated and untreated-control hAECs on day 7 (performed in Transcriptome Analysis Console version 4 software). The vertical axis (y-axis) corresponds to -log10 p-value of the ANOVA p-values, and the horizontal axis (x-axis) displays linear fold change. The red dots represent the up-regulated genes; the green dots represent the downregulated genes. (B) Distribution of fold changes in mRNA expression levels in verbenalin-treated hAECs (C) Pie chart showing the enriched (p < 0.05) tissue expressions by the DEGs between verbenalin-treated and untreated-control hAECs on day 7 (analyzed by DAVID online tool).