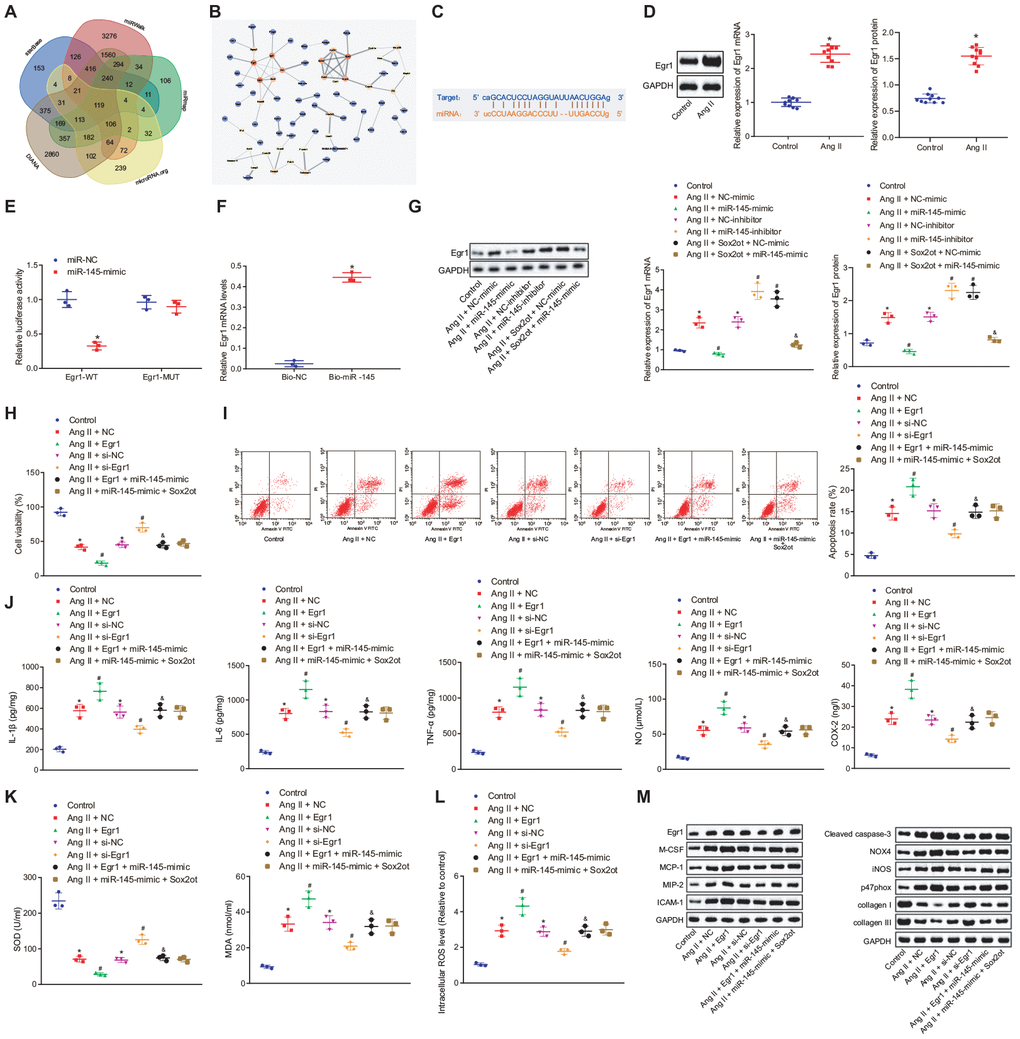
Figure 6.Silencing of lncRNA Sox2ot binding miR-145 inhibits oxidative stress and inflammation of Ang II-treated VSMCs by downregulating Egr1. (A) Venn map for 119 intersection genes predicted to be regulated by miR-145 in the DIANA (http://diana.imis.athena-innovation.gr/DianaTools/index.php?r=microT_CDS/index), miRWalk (http://mirwalk.umm.uni-heidelberg.de/), miRmap (https://mirmap.ezlab.org/), microRNA.org (http://www.microrna.org/microrna/home.do), and starBase (http://starbase.sysu.edu.cn/index.php); (B) a PPI network using Cytoscape 3.6.0 software for target genes of miR-145 was constructed using string database (https://string-db.org/); the color represents the correlation between miR-145 and other genes, and red represent the high correlation; (C) the complementary binding sites between miR-145 and Egr1 3'-UTR predicted by StarBase; (D) Egr1 mRNA and protein levels in the abdominal aorta of normal mice and Ang II-induced AAA mice determined by RT-qPCR and Western blot analysis; (E) interaction between miR-145 and Egr1 detected by dual luciferase reporter gene assay; (F) the interaction between miR-145 and Egr1 verified by RNA pull down assay; (G) Egr1 mRNA and protein levels in VSMCs determined by RT-qPCR and Western blot analysis; (H) cell viability of VSMCs detected by CCK-8 assay; (I) apoptosis of VSMCs detected by flow cytometry; (J) levels of COX-2, NO, IL-1β, IL-6, and TNF-α in serum of VSMCs Egr1 and/or Sox2ot/miR-145 measured by ELISA; (K) levels of MDA and SOD in serum of VSMCs measured using kits; (L) ROS level in VSMCs measured by kits; (M) protein levels of cleaved caspase-3, NOX4, iNOS, p47phox, collagen I and collagen III in VSMCs determined using Western blot analysis; * p < 0.05, vs. normal mice or VSMCs without treatment; # p < 0.05, vs. VSMCs treated with Ang II + NC-mimic, Ang II + NC-inhibitor, Ang II + NC, or Ang II + si-NC plasmids; & p < 0.05, vs. VSMCs treated with Ang II + NC-mimic or Ang II + Egr1 plasmids; measurement data were depicted as the mean ± standard deviation; comparisons between the two groups were analyzed using unpaired t-test (n = 10), and comparisons among multiple groups were analyzed using one-way ANOVA, followed by Turkey’s post hoc test; the experiment was repeated three times.
Figure 6 — Silencing of long non-coding RNA Sox2ot inhibits oxidative stress and inflammation of vascular smooth muscle cells in abdominal aortic aneurysm via microRNA-145-mediated Egr1 inhibition | Aging