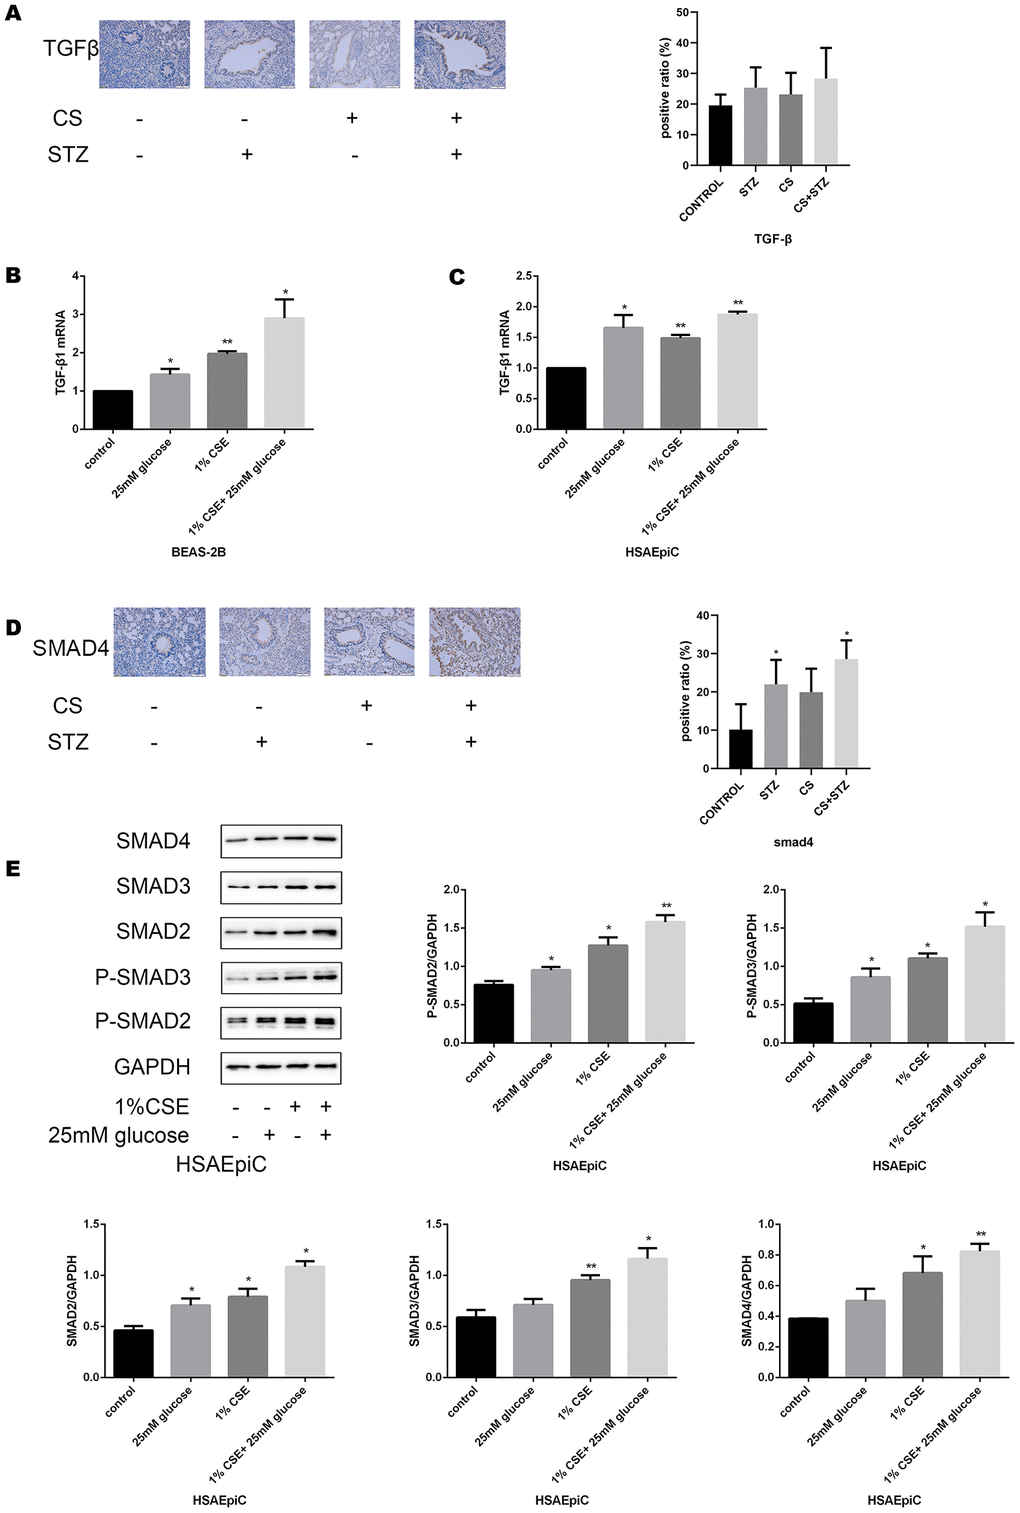
Figure 4A–E.High glucose levels and CS exposure activated the TGF-β signaling pathway. (A) Immunohistochemical results and positive ratios of TGF-β1 in control, COPD, diabetic and COPD diabetic rats. (B, C) AECs were treated with 25 mM glucose, 1% CSE or both for 24 hours. qRT-PCR results of TGF-β1 in BEAS-2B (B) and HSAEpiC (C) cells. (D) Immunohistochemical results and positive ratios of Smad4 in CS-induced COPD, diabetic and COPD diabetic rats. (E–H) AECs were treated with 25 mM glucose, 1% CSE or both for 24 hours.