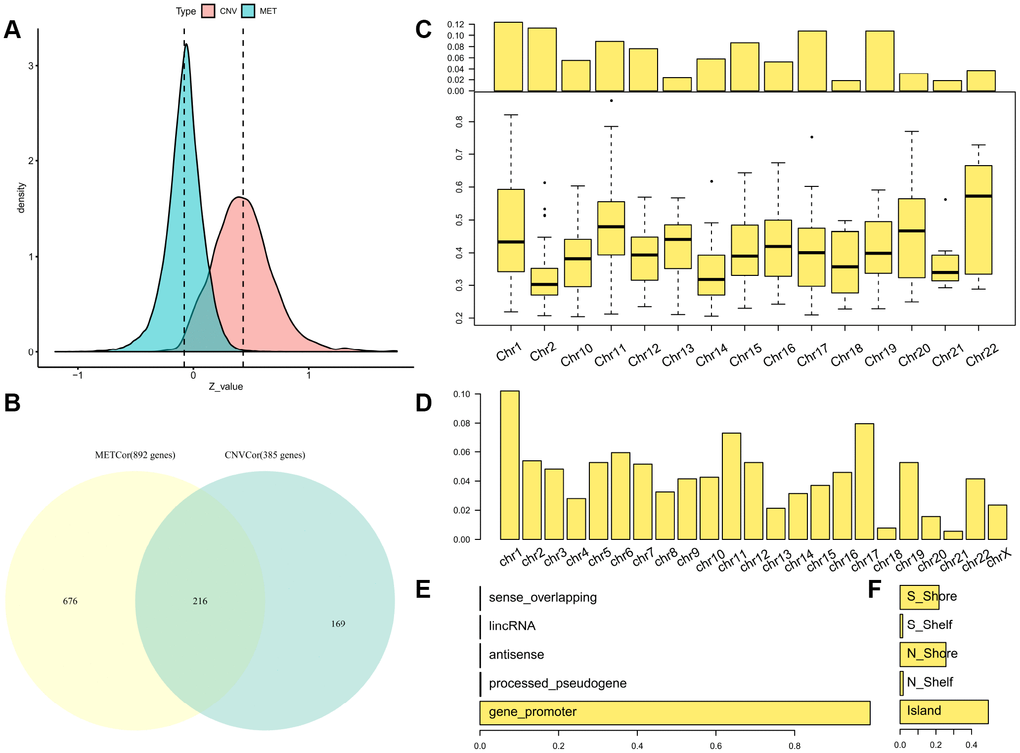
Figure 1.Identification of DNA copy-number-correlated (CNVcor) and DNA methylation-correlated (METcor) genes in SKCM. (A) Distribution of correlation coefficients between mRNA expression levels and DNA copy number or DNA methylation across samples. (B) Venn diagram showing counts of CNVcor genes, METcor genes, and overlapping genes. (C) Proportional frequencies of CNVcor genes against total gene counts in each chromosome arm. (D) Proportional frequencies of METcor genes against total gene counts in each chromosome arm. (E, F) Genomic positions of DNA methylation probes are categorized based on positional relations with CpG islands (right) and genes (left).